The Office of Evaluation, Research, & Accountability (ERA) uses data and research to drive continuous improvement in Philadelphia’s schools. We empower educators with the information they need to make effective decisions and create positive change for students. Learn more about how we support schools, collaborate on district initiatives, and promote impactful research.
Evaluation, Research, and Accountability
Goals and Guardrails
In 2020-21, the School District of Philadelphia’s Board of Education established Goals and Guardrails that outline what our students must know and be able to accomplish, and describe conditions needed in each school to empower all students to succeed in and beyond the classroom.
The Progress Monitoring process ensures that the Board of Education and all members of the community can see the impacts of these efforts. Each Goal will be publicly monitored at regular intervals throughout the year, and each Guardrail will be publicly reported once a year at Board meetings.
In April 2024, the Board of Education approved a new timeline and adjusted baselines and targets, which are reflected below. To view the previous timeline and targets, see this summary document from August 2023.
Goals
Goal 1: Reading
The percentage of students in grades 3-8 who are proficient on the state ELA assessment will grow from 34.0% in August 2023 to 65.0% by August 2030.
Leading Indicators – Updated August 2023
- 1.1: The percentage of students in grades 3-8 who are At Target on the District’s within-year reading assessment.
- 1.2: The percentage of students in grades 3-8 with high growth on the District’s within-year reading assessment.
Progress Monitoring Reports
- February 2026
- October 2025
- February 2025
- October 2024
- March 2024
- September 2023
- March 2023
- August 2022
- February 2022
- July 2021
- March 2021
Research
Goal 2: Reading
The percentage of 3rd grade students who are proficient on the state ELA assessment will grow from 31.0% in August 2023 to 62.0% by August 2030.
Leading Indicators – Updated August 2023
- 2.1: The percentage of students in grade 3 who are At Target on the District’s within-year reading assessment.
- 2.2: The percentage of students in grades K-2 who are At Target on the District’s required reading Curriculum-Based Measures.
Progress Monitoring Reports
- February 2026
- October 2025
- February 2025
- October 2024
- March 2024
- September 2023
- March 2023
- August 2022
- March 2022
- July 2021
- January 2021
Research
Goal 3: Math
The percentage of students in grades 3-8 who are proficient on the state Math assessment will grow from 20.7% in August 2023 to 52.0% by August 2030.
Leading Indicators – Updated August 2023
- 3.1: The percentage of students in grades 3-8 who are At Target on the District’s within-year math assessment.
- 3.2: The percentage of students in grades 3-8 with high growth on the District’s within-year math assessment.
- 3.3: The percentage of students in grades K-2 who are At Target on the District’s required math Curriculum-Based Measures.
Progress Monitoring Reports
- January 2026
- October 2025
- January 2025
- October 2024
- February 2024
- September 2023
- April 2023
- July 2022
- April 2022
- August 2021
- February 2021
Research
Goal 4: College & Career
Updated August 2025
- Goal 4a: The percentage of students who are proficient on the state Literature high school assessment will grow from 39.5% in August 2023 to 56.2% by August 2030.
- Goal 4b: The percentage of students who are proficient on the state Algebra high school assessment will grow from 14.1% in August 2023 to 36.8% by August 2030.
- Goal 4c: The percentage of students who are proficient on the state Biology high school assessment will grow from 20.5% in August 2023 to 43.7% by August 2030.
Leading Indicators
- 4.1: Pending new indicator
- 4.2: The percentage of first-time 9th-grade students who are meeting the District’s 9th Grade Firmly On-Track metric.
Progress Monitoring Reports
- May 2026
- December 2025
- March 2025
- November 2024
- April 2024
- October 2023
- June 2023
- September 2022
- May 2022
- October 2021
- April 2021
Research
Goal 5: College & Career
The percentage of Career and Technical Education (CTE) students who pass an industry standards-based competency assessment by the end of their 12th grade year will grow from 49.1% in August 2023 to 80.0% in August 2030.
Leading Indicators – Updated August 2023
- 5.1: The percentage of eligible students who take and pass the NOCTI.
- 5.2: The percentage of CTE students who have a documented job placement and/or postsecondary opportunity.
Progress Monitoring Reports
- June 2026
- December 2025
- May 2025
- November 2024
- April 2024
- October 2023
- June 2023
- September 2022
- May 2022
- October 2021
- June 2021
Research
Guardrails
Guardrail 1: Safe and Welcoming Schools
Every school will be a safe, welcoming, and healthy place where our students, staff, and community want to be and learn each day.
This means that our schools will be: 1) environmentally safe and clean; and 2) spaces with inclusive climates that provide students with access to robust social, emotional, and mental health supports.
Leading Indicators – Updated August 2023
- 1.1: The percentage of school-based positions filled each year by October by employees with standard credentials in the 50 lowest performing schools.
- 1.2: The average completion time for Work Orders specific to restrooms and hydration stations.
Progress Monitoring Reports
Research
Guardrail 2: Enriching and Well-Rounded Experiences
Every student will have a well-rounded education with co-curricular opportunities, including arts and athletics, integrated into the school experience.
Leading Indicators – Updated August 2023
- 2.1: The percentage of K-12 students enrolled in a visual or performing arts course at each school.
- 2.2: The percentage of K-12 students participating in co-curricular activities, including athletics, at each school.
Progress Monitoring Reports
Research
Guardrail 3: Partnering with Parents & Family Members
Every parent and guardian will be welcomed and encouraged to be partners in their child’s school community.
Leading Indicators – Updated August 2023
- 3.1: The number of school-sponsored community events held at each school.
- 3.2: The percentage of staff trained to use language access services.
Progress Monitoring Reports
Research
Guardrail 4: Addressing Racist Practices
Our students’ potential will not be limited by practices that perpetuate systemic racism and hinder student achievement.
Leading Indicators – Updated August 2023
- 4.1 (a): The percentage of 4th and 8th grade students who are qualified to attend criteria-based schools, by student group.
- 4.1 (b): The percentage of qualified 4th and 8th-grade students who applied and attend criteria-based schools, by student group.
- 4.2: The number of K-8 schools offering Algebra and World Languages.
Progress Monitoring Reports
Research
Frequently Asked Questions
What are the Leading Indicators?
SDP has developed research-based leading indicators for each Goal and Guardrail that will indicate progress through 2030. These will be included in monthly Progress Monitoring reports presented to the Board, and they will also be included in the District’s annual accountability framework, the School Progress Report for Equity and Education (SPREE).
What is the Board’s approach to Progress Monitoring?
Decision-making will center around four lines of inquiry:
- Who? Are we progressing toward the goals as expected? Which schools are on-track? Which are near-track? Which are off-track?
- What? Which circumstances surrounded the data for struggling and excelling students?
- Why? Which events, decisions, or activities help describe what happened?
- How? Which changes will the Leadership Team make based on the data?
How does the Office of Evaluation, Research, and Accountability (ERA) support the Goals and Guardrails?
ERA supports the Goals by collecting data on Leading Indicators, including the percentage of students reading on grade level, the percentage of students performing on grade level in math, graduation rates, matriculation rates, and the percentage of English learners meeting or exceeding their individual progress goals. This information is compiled in the annual Accountability Framework, a tool used to track school- and District-level progress, and it is also available on our School Profiles, an interactive dashboard designed to increase the public accessibility of the data.
ERA supports the Guardrails by including measures of equity in growth by student group on the annual Accountability Framework. We also administer the Philly School Experience Survey (PSES), which gathers feedback from students, teachers, principals, and parents/guardians about key topics related to school improvement, including climate (Guardrails 1 and 2) and family engagement (Guardrail 3). We are also committed to examining issues of equity and anti-racism in our reports and briefs, which provide timely and actionable analyses of school- and District-level data.
Where can the public access more information about schools and Leading Indicators?
Our Open Data project includes longitudinal data sets spanning various school and student performance areas.
Student Assessments
The Office of Assessment maintains the Assessment Calendar and coordinates the administration of a number of assessments including ACCESS, Keystones, PSSA, PASA, and Star.
Overview of Assessments in SDP
Assessments coordinated by other offices
ACCESS
What is ACCESS?
ACCESS is a standards-based English language proficiency test for students in Grades K-12 designed to measure English language learners’ proficiency in English. It assesses social and instructional English as well as the language associated with Language Arts, Mathematics, Science and Social Studies within the school context across the four language domains of listening, speaking, reading and writing.
Resources & FAQs
Keystones
Resources & FAQs
Keystone Family Guide
English | Shqip | عربي| 中文 | Français | Kreyòl ayisyen | ភាសាខ្មែរ | Português | Русский | Español | Yкраїнська | O’zbek | Việt
Test Features and Accommodations
English | Shqip | عربي | 中文 | Français | Kreyòl ayisyen | ភាសាខ្មែរ | Português | Русский | Español | Yкраїнська | O’zbek | Việt
Code of Conduct for Test Takers (from PDE)
English | Shqip | عربي | 中文 | Français | ភាសាខ្មែរ | Português | Русский | Español | Việt
More Information
- Electronic Devices Policy (from PDE)
- Visit PDE’s Keystone site to learn more about the Keystone test design.
- Opting out: If the test conflicts with their religious beliefs, parents and guardians have the right to opt out of their child’s Keystone exam participation by providing a written request. Contact your child’s school for more information.
PSSA/PASA
Resources & FAQs
PSSA Family Guide
English | Shqip | عربي | 中文 | Français | Kreyòl ayisyen | ភាសាខ្មែរ | Português | Русский | Español | Yкраїнська | O’zbek | Việt
PASA Family Guide
English | Shqip | عربي | 中文 | Français | ភាសាខ្មែរ | Português | Русский | Español | Việt
PSSA FAQ for Families (from PDE)
English | Shqip | عربي | 中文 | Français | Kreyòl ayisyen | ភាសាខ្មែរ | Português | Русский | Español | Yкраїнська | O’zbek | Việt
Test Features and Accommodations
English | Shqip | عربي | 中文 | Français | Kreyòl ayisyen | ភាសាខ្មែរ | Português | Русский | Español | Yкраїнська | O’zbek | Việt
Code of Conduct for Test Takers (from PDE)
English | Shqip | عربي | 中文 | Français | ភាសាខ្មែរ | Português | Русский | Español | Việt
More Information
- Electronic Devices Policy (from PDE)
- Visit PDE’s PSSA site to learn more about the PSSA test design.
- Opting out: If the test conflicts with their religious beliefs, parents and guardians have the right to opt out of their child’s participation in PSSA/PASA by providing a written request. Contact your child’s school for more information.
Star
What are Star Assessments?
Star Assessments (published by Renaissance Learning) are a suite of computer-adaptive tests (CATs) and curriculum-based measures (CBMs) that:
- measure students’ reading and math skills
- monitor achievement and growth, and
- track how well students understand skills aligned to the Common Core standards.
Star results are used to identify students who are meeting grade- and term-level benchmarks in literacy and math, as well as those who may need additional support or interventions. As a District, we are also using the CATs to monitor our students’ progress toward meeting our District-wide Board Goals.
How is Star Administered?
Star is administered during specific windows each school year.
Both the curriculum-based measures (CBMs) and the computer-adaptive tests (CATs) are timed assessments.
All CBMs are 60 second assessments that are administered by a teacher.
The CATs are timed as well, with time limits varying from 45 seconds to 3 minutes depending on the type of question asked. Unlike the CBMs, students are administered the CATs on a computer. In general, students typically require 15-25 minutes to complete a CAT. Students with IEPs are able to receive extended time for the CATs.
The CATs are adaptive tests, which means that questions become more or less difficult depending on student responses. For example, if a student answers a question incorrectly, the next question may be easier. Therefore, two students taking the same assessment may receive different sets of questions depending on their responses.
Student Proficiency and Growth
Star measures student performance and growth using multiple metrics. The District uses four primary metrics:
- Scaled Score: A student’s scaled score is calculated based on the difficulty of the questions they answered and the number of correct responses they provided. Because the same range of questions is used for students across all grade levels, scaled scores can be used to compare student performance across grade levels. All norm-referenced scores, such as the Percentile Rank and SGP (see below), are based on a student’s scaled score. Both Star Reading and Star Math scaled scores range from 0 to 1400.
- Percentile Rank: A student’s percentile rank is a norm-referenced performance measure that compares a student’s scaled score to their grade-level peers nationwide. The Percentile Rank is useful for understanding a student’s current mastery of reading and math skills compared to other students in the same grade nationally.
- Tier: A student’s tier is based on their Percentile Rank. Students are categorized into one of four performance Tiers: At/Above Benchmark, On Watch, Strategic Intervention, and Intensive Intervention. The tiers indicate the level of intervention students need in order to reach proficiency.
- Student Growth Percentile (SGP): The SGP is a norm-referenced metric that compares a student’s growth to their “academic peers”—i.e., students in the same grade with a similar Star scaled score history—nationwide. SGP is measured on a 1-99 scale. Lower numbers indicate lower relative growth compared to academic peers, and higher numbers indicate higher relative growth compared to academic peers. For example, an SGP of 75 means that the student has shown more growth than 75% of her academic peers.
Using the Data
The District uses Star data to track school-level proficiency for grades K-12 in Reading and grades 3-12 in Math in alignment with our District’s Board Goals. Additionally, after each testing window, teachers analyze their students’ data using a structured protocol in order to get a sense of student performance in their classroom(s) in terms of both growth and proficiency. Teachers are encouraged to use Star data in considering how they might need to adjust their instruction to best serve their students.
Family Resources
Translated Parent Guides (PDF)
-
Grades K-5
Albanian | Arabic Ι Chinese Ι English Ι French Ι Khmer Ι Portuguese Ι Russian Ι Spanish Ι Vietnamese -
Grades 6-12
Albanian Ι Arabic Ι Chinese Ι English Ι French Ι Khmer Ι Portuguese Ι Russian Ι Spanish Ι Vietnamese
Video Guides for Families
Why is my child taking the Star assessments and how is this information useful for me as a parent?
In this screencast, we discuss why your child is taking the Star assessments and how information from the Star assessments is useful to you as a parent.
Watch in your language: English | Chinese | Spanish
What are the Star assessments and when does my child take them?
This is the second screencast in a multi-part series on the School District of Philadelphia’s use of Star testing. In this screencast, we explain the ins and outs of the Star assessments while also reviewing which Star tests your child will take and when they’ll take them.
Watch in your language: English | Chinese | Spanish
Star Spanish FAQs
- Which Star Tests are available in Spanish?
Star Reading and Star Math Computer Adaptive Tests (CATs) and Star Curriculum Based Measures (CBMs) are available in Spanish. - Are the Spanish versions of the Star Computer Adaptive Tests (CATs) similar to the English versions of these tests? Yes, the Spanish versions of the Computer Adaptive Tests are also 34 questions long, and consist entirely of multiple choice questions.
- Are the Spanish versions of the Star Computer Adaptive Tests (CATs) appropriate for all grade-levels?
The Spanish versions of the Computer Adaptive Tests are most appropriate for students in grades 1-8. High School students who take Star Spanish will not receive certain key data points around their growth and achievement. - How do I know whether a child should take the Spanish versions of the Star Computer Adaptive Tests (CATs)?
The Office of Multilingual Curriculum and Programs has provided guidance for all schools around which Star tests multilingual learners’ need to be administered. Complete guidelines for the current school year are available here.
Star Tested Skills by Grade
Star Early Literacy (K-2)
Star Early Literacy assesses proficiency in three broad domains: Word Knowledge and Skills, Comprehension Strategies and Constructing Meaning, and Numbers and Operations. Star Early Literacy scaled scores provide an individualized assessment of students’ literacy/numeracy skill development to identify students who need intervention or enrichment on specific skills. Scores will enable teachers to easily track progress and facilitate individualized instruction.
Domain |
Skills/Topics Assessed |
|---|---|
Word Knowledge and Skills |
Measures students’ letter recognition, phonemic awareness, and word decoding skills, as well as their ability to apply phonics and vocabulary strategies to identify new words. |
Comprehension Strategies and Constructing Meaning |
Measures students’ comprehension through written and oral word identification, sentence topic identification, and multiple-choice questions about story passages. |
Numbers and Operations |
Measures students’ early numeracy development through number naming and recognition, counting and ordering, and simple addition and subtraction. |
Star Reading (3-12)
Star Reading assesses students’ skills in vocabulary, reading comprehension, analyzing literary text, understanding author’s craft, and analyzing argument and evaluating text. Students are asked a total of 34 reading questions, which include 10 questions about vocabulary in context, as well as a range of questions spanning the domains. However, the number of questions in each domain presented to a student depends on their grade.
Domain |
Skills/Topics Assessed |
|---|---|
Vocabulary: Word Knowledge and Skills |
Measures students’ knowledge and understanding of vocabulary, as well as their ability to apply vocabulary strategies. |
Comprehension Strategies and Constructing Meaning |
Short passages ask students to use strategies such as self-monitoring, making predictions, drawing conclusions, and using the organizational structure of the text to improve understanding. |
Analyzing Literary Text |
Students are asked to explore the plot, setting, character, theme, and point of view in literary text, as well as the characteristics of different genres. |
Understanding Author’s Craft |
Measures students’ understanding and analysis of an author’s use of language and literary devices to create certain effects. |
Analyzing Argument and Evaluating Text |
Asks students to recognize, analyze, and evaluate arguments in persuasive, editorial, and academic writing. |
Star Math (3-12)
Star Math assesses students’ skills in numbers and operations; algebra, geometry and measurement; and data analysis, statistics, and probability. Students are asked a total of 34 math questions. However, the number of questions in each domain presented to a student depends on their grade.
Domain |
Skills/Topics Assessed |
|---|---|
Numbers and Operations |
Measures students’ ability to count and compare numbers; add, subtract, multiply, and divide whole numbers, fractions, and decimals. This domain also covers primes, square roots, percentages, and numerical expressions. |
Algebra |
Students are asked to graph points and functions, evaluate variables, solve linear and nonlinear equations, simplify expressions, and complete other key algebraic tasks. |
Geometry and Measurement |
Measures students’ ability to identify shapes, lines, and angles; determine and convert measurements; tell time; calculate the perimeter, area, volume, and surface area of shapes; and determine missing measurements or dimensions. |
Star Reading Curriculum-Based Measures (CBM) (K-5)
Star Curriculum-Based Measures (CBMs) are designed to assess discrete, foundational grade-level literacy skills. In kindergarten and first grade, this includes students’ understanding of letters and their sounds, basic phonological awareness, and early decoding. In second through fifth grade, CBMs assess students’ reading progress. CBM scores are presented as the number of items students answer correctly in one minute. The following section provides additional data about what the Star CBM Reading assessments will measure at each grade level.
Grade |
Domain |
Skills/Topics Assessed |
|---|---|---|
Kindergarten |
Letter naming |
The number of upper- and lowercase letters students can identify in a random sequence. |
Kindergarten |
Receptive nonsense words |
The number of nonsense words students can identify when presented with both CVC words and CVC nonsense words. Administered as a verbal assessment. |
Kindergarten, Grade 1 |
Letter sounds |
The number of letter sounds (consonants only; no vowels a, e, i, o, u, or y are included) that students can pronounce. |
Kindergarten, Grade 1 |
Phoneme segmentation |
The number of phoneme components students can pronounce in common 3-phoneme grade-level appropriate words. |
Grades 1-2 |
Expressive nonsense words |
The number of nonsense words students can identify when presented with both CVC words and CVC nonsense words. Administered as a written assessment. |
Grades 1-5 |
Oral passage reading |
The number of words students can identify in a grade-level appropriate text. |
Star Math Curriculum-Based Measures (CBMs) (K-3)
Curriculum Based Measures are designed to assess discrete, foundational grade-level math skills. Star CBM Math assesses kindergarten and first-grade students’ developing math competency, including recognizing numerals and their value. For second- and third-grade students’ their basic facts in addition, subtraction, and multiplication will be assessed. CBM scores are presented as the number of items students answer correctly in one minute. The following table provides additional information about the math skills Star CBMs will measure at each grade level.
Grade |
Domain |
Skills/Topics Assessed |
|---|---|---|
Kindergarten, Grade 1 (Fall) |
Numeral recognition |
How many numbers between 0-100 students can identify when presented in a random order. |
Kindergarten, Grade 1 |
Quantity comparison |
How many times students can identify the larger number (0-30) in a given pair. |
Grades 1-2 |
Addition to 10 |
The number of addition problems students can solve correctly. (All answers will equal no greater than 10.) |
Grade 2 |
Addition to 20 |
The number of addition problems students can solve correctly (all answers will equal no greater than 20.) |
Grades 2-3 |
Subtraction from 10 |
The number of subtraction problems students can solve correctly (all answers will equal 10 or less.) |
Grade 3 |
Mixed addition and subtraction |
The number of addition and subtraction problems using numerals between 0 and 20 students can solve correctly. (All answers will equal no greater than 20.) |
Grade 3 |
Multiplication to 100 |
The number of correct responses to multiplication problems using numerals between 0 and 10. (All answers will equal no greater than 100.) |
PSAT & SAT
SAT Suite of Assessments
- The SAT Suite of Assessments includes a series of assessments students take in high school to measure reading, writing, and math skills. Data from the assessments can help guide students’ plans for college and career.
- Participating in the assessments is optional and does not cost students any money.
PSAT 8/9
- The PSAT 8/9 is offered to 9th grade students during school hours in October. Schools choose their own testing dates.
- Scores from the assessment identify students’ strengths and areas for improvement, indicate Advanced Placement course readiness, and establish a baseline to allow students to track their progress if they take the PSAT/NMSQT and SATs.
- Visit the College Board Scores page for more information on how to view and understand PSAT 8/9 scores.
PSAT/NMSQT
- The Preliminary SAT/National Merit Scholarship Qualifying Test (PSAT/NMSQT) is offered to 10th and 11th grade students during school hours in October. Schools choose their own testing dates.
- Scores from the assessment identify students’ strengths and areas for improvement, indicate Advanced Placement course readiness, and track progress if they participated in the PSAT 8/9. Students’ performance on the assessment can also qualify them for the National Merit Scholarship Program and other scholarships.
- Visit the College Board Scores page for more information on how to view and understand PSAT/NMSQT scores.
SAT
- The SAT is offered to 11th grade students during school hours in March and April. Schools choose their own testing dates.
- The SAT is an entrance exam used by many colleges and universities to make admissions decisions. Additionally, scores from the assessment identify students’ strengths and areas for improvement and track their progress if they participated in the PSAT 8/9 and/or PSAT/NMSQT.
- Students who want to take the SAT outside of the 11th grade spring testing window can register for the Saturday SAT. The Saturday SAT is offered throughout the year. See the SAT Dates and Deadlines page for specific dates. Fee waivers for the Saturday SAT can be obtained from high school counselors.
- Visit the College Board Scores page for more information on how to view and understand SAT scores.
Naglieri Nonverbal Ability Test (NNAT3)
What is the Naglieri Nonverbal Ability Test?
- The NNAT3 is a brief, nonverbal assessment that uses visual information such as shape puzzles and patterns rather than words to evaluate specific skills. There is no reading or speaking required. A nonverbal assessment evaluates a student’s ability to analyze and solve complex problems without relying upon or being limited to language or reading abilities.
- Scores from the assessment are used as one piece of evidence in the gifted evaluation process and help teachers identify the best ways students learn.
- The NNAT3 is administered to all 2nd grade students during April and May. Schools choose their own testing dates.
School Planning and Evidence-based Supports
The Planning and Evidence-based Supports Office (PESO) provides District schools with the necessary guidance to enact the policy requirements of various federal programs, including Title I, NCLB, and the new Every Student Succeeds Act (ESSA). We also lead the development of school- and District-level comprehensive plans that address student achievement needs and guide progress toward improved student outcomes. These plans include a strategic cycle to monitor the implementation of the plan, identify evidences of success, and revise the plan using data-driven decision-making processes.
School Improvement Plans 2026-27
These plans have been developed by school teams with assistance from central office programmatic support team members. We have also included a link to the school’s recent Monthly Data Snapshot, for reference purposes.
We encourage all stakeholders to review your school’s plan and to complete a feedback form, which is available in English, Spanish, Chinese, and Arabic.
Comprehensive Plan and Supplemental Reports
The Pennsylvania Department of Education requires that Comprehensive Plans be developed every three years. However, it’s important to note that our district treats its Comprehensive Plan as a living document.
Resources
- Comprehensive Plan, 2025 – 2028
- Professional Development Plan (Act 48), 2025 – 2028
- Gifted Education Plan Assurances (Chapter 16), 2025 – 2028
- Induction Plan (Chapter 49), 2025 – 2028
Future Ready PA Index
The Future Ready PA Index is PDE’s one-stop location for comprehensive progress measures related to school and student success. The Index includes a wide range of assessment, on-track, and readiness indicators to accurately report student learning, growth, and success in the classroom and beyond.
Programs & Services
PVAAS
The power in PVAAS comes from using key PVAAS reports to inform the work you do every day! To help you learn to use PVAAS effectively, the PVAAS Statewide Team has created professional learning resources for school leaders, district leaders, and teachers. Each set of resources focuses on learning to use the PVAAS data to support and inform a specific task or goal.
Questions about PVAAS? Requests for PVAAS training? Contact jctaylor@philasd.org
e-Metric
This site is designed to provide quick, easy, and secured access to student performance results on the Keystone Exams, the Pennsylvania System of School Assessment (PSSA), the Pennsylvania System of School Assessment Modified (PSSA-M), and the Pennsylvania Alternate System of Assessment (PASA). On this site, you will find a wealth of information at your fingertips in a highly interactive and flexible format.
To set up your initial username and password contact Jeff Robinson at jrobinson2@philasd.org.
School Improvement Data Specialists by Network
Network |
PESO Staff |
|---|---|
LN1 |
Maggie Pedone |
LN2 |
Laura Favatas |
LN3 |
Josh Culbertston |
LN4 |
Maggie Pedone |
LN5 |
Conor Richardson |
LN6 |
AnnMarie Schamper |
LN7 |
Conor Richardson |
LN8 |
AnnMarie Schamper |
LN9 |
Josh Marley |
LN10 |
Josh Culbertson |
LN11 |
Joe Taylor |
LN12 |
Raquel Alvara |
LN13 |
Seth Morones |
LN14 |
Joe Taylor |
LN15 |
Raquel Alvara |
Opportunity |
Seth Morones |
School Profiles Dashboard
Our interactive School Profiles dashboard is a resource for families, researchers, policy makers, and community members who want reliable information about Philadelphia’s public schools and how they’re performing.
The dashboard shows detailed information about all District, Alternative, and Charter schools in Philadelphia. Annual data on test scores, graduation rates, student enrollment, and school climate are available all in one place.
School Profiles allows you to look at individual schools or compare several schools at once. You can also filter information by sector, learning network, city council district, admission type, or grade level.
Additional Dashboards
If you need information beyond the overviews provided in School Profiles, we offer specialized dashboards that focus on key topics, allowing you to explore them in greater detail.
October 1 Enrollment
Enrollment, catchment, and demographic data from a yearly snapshot taken on October 1
Daily Student Attendance
Summary of student attendance by school day, including percentage of students with Regular Attendance (90%+), for students enrolled in District and Alternative schools; Charter schools are not included
PSSA & Keystone Performance
PSSA/Keystone performance indicators, including PASA results, for District and Alternative schools; Charter schools are not included
College & Career
9th Grade on Track, graduation, college matriculation, and college persistence data
Philly School Experience Survey
Response rates, topic scores, and a question explorer for the annual survey of Philadelphia public school students, families, and school staff. To learn more about the PSES, visit: philasd.org/pses
School Progress Report on Education and Equity (SPREE)
Summary of the metrics calculated for the annual SPREE reports. To learn more about the SPREE, visit: philasd.org/spree
SPOTlight and School Progress Report on Education and Equity (SPREE)
The SPOTlight and SPREE are released every year to provide a summary of how each school is performing and improving on the Goals & Guardrails and other important measures in key areas.
 Reading & English Language Arts (ELA)
Math & Science

College & Career Readiness

Climate, Culture & Opportunity (Conditions for Success)
SPREE, SPOTlight, and Board of Education Goals & Guardrails
![]() In December 2020, the Board of Education (BOE) established the Goals & Guardrails, which set clear priorities for what our students must know and be able to accomplish, and describe the conditions that must be in place at each school to empower our students to succeed in and beyond the classroom.
In December 2020, the Board of Education (BOE) established the Goals & Guardrails, which set clear priorities for what our students must know and be able to accomplish, and describe the conditions that must be in place at each school to empower our students to succeed in and beyond the classroom.
The District set annual targets that schools need to meet to show they are making progress toward the Goals & Guardrails. The School Progress Report on Education and Equity (SPREE) and the SPOTlight summaries are critical tools that show each school’s progress toward the annual targets and performance on other important measures like attendance and graduation rates. This guide will help you understand the SPREE report for your child’s school, and it provides tips for how you can support your child’s success.
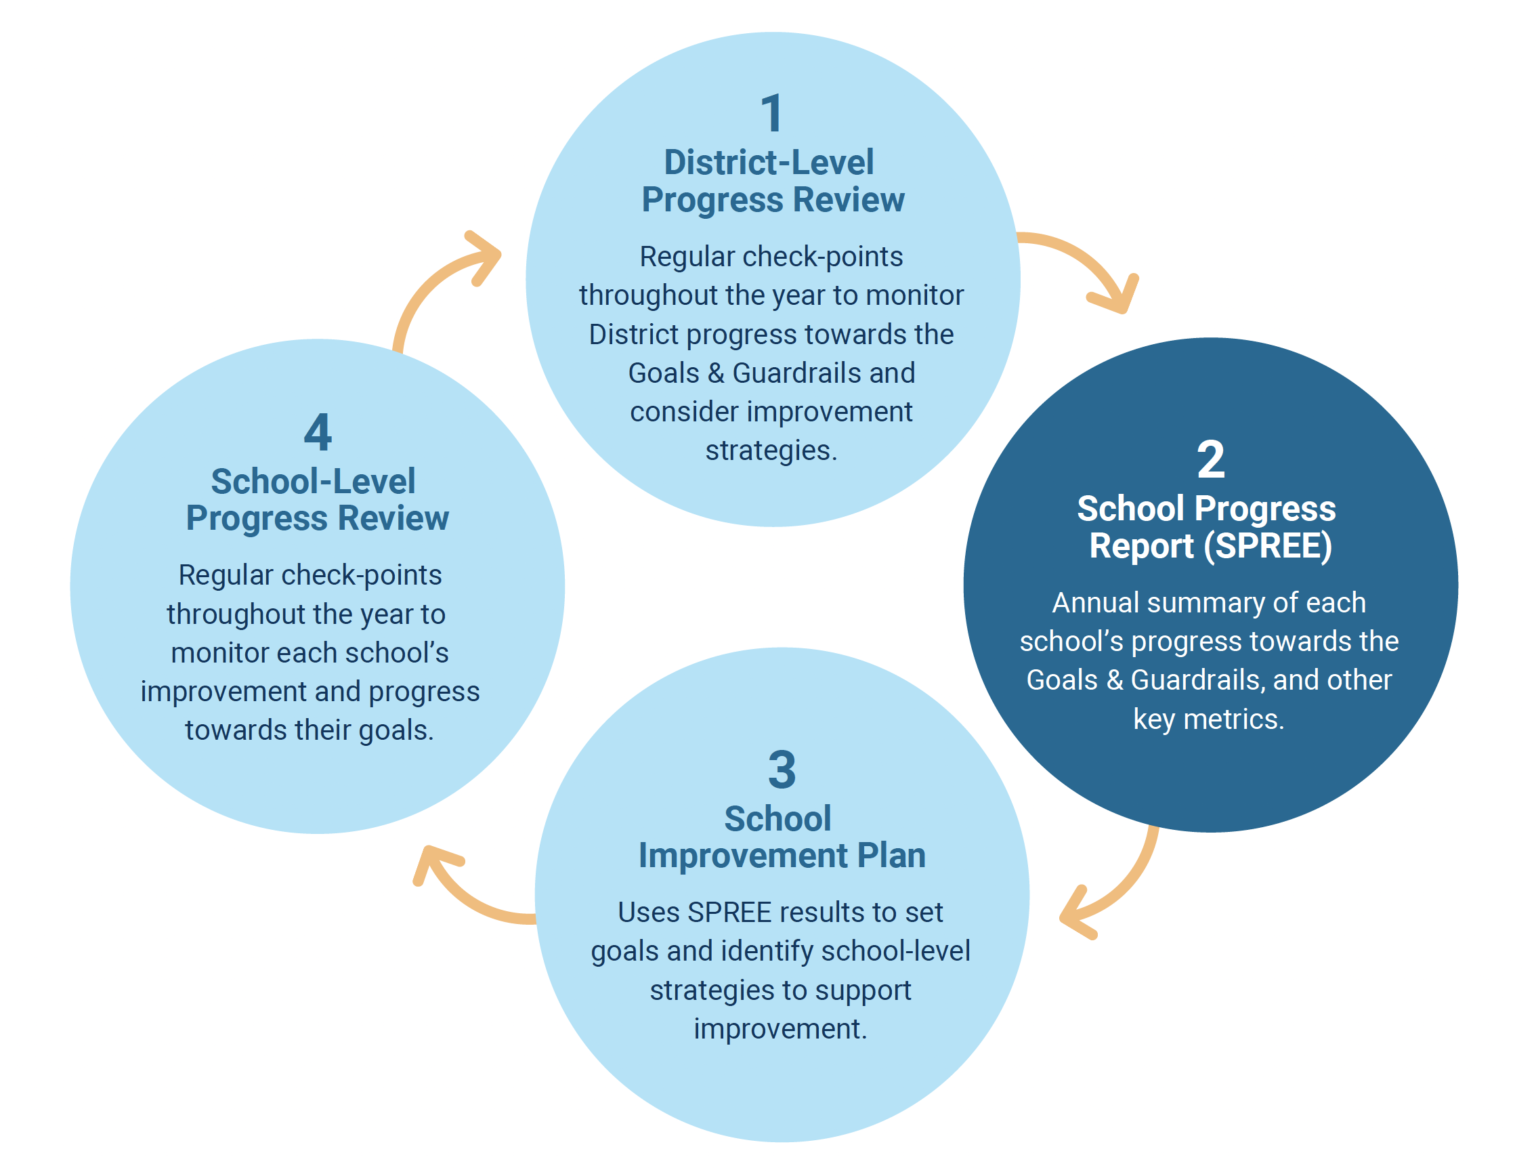
Goals & Guardrails Annual Improvement Cycle
Schools use their SPREE to create a school improvement plan for the next year to better support student learning and continue progress toward the Goals & Guardrails.
Understanding Your SPREE Level
A note about the school year 2024-2025 SPREE: For the 2024-2025 reports, overall school levels are available for District schools only. Charter school reports only include changes in school performance (Improving, Maintaining, Not Improving) from 2023-2024.
There are between 9 and 21 different measures evaluated in the SPREE, depending on the grade levels that a school serves. For each measure, your school’s SPREE report provides two pieces of information. First, it tells us whether a school is meeting the annual target for that measure. Second, it tells us whether the school improved on that measure from the year before.
Based on information about change in performance over time, each measure gets a color label:
- Improving: The school improved from the previous year.
- Maintaining: The school maintained its performance from the previous year.
- Not Improving: The school did not improve from the previous year.
District school reports also include information on how the school performed against District and school-level targets:
- Meeting 2030 Goal: The school is performing at or above the District’s 2030 goal.
- Meeting: The school is performing below the 2030 goal but at or above the school’s current-year goal.
- Not Meeting: The school is performing below its current-year goal.
The SPREE will then provide each school an overall level — the combined result of its performance and improvement on each target or measure:
- Level 1: Improving on at least half of metrics and meeting most or all performance targets
- Level 2: Improving on at least half of metrics and meeting some performance targets
- Level 3: Improving on at least half of metrics and generally not meeting performance targets
- Level 4: Improving on less than half of metrics and meeting most or all performance targets
- Level 5: Improving on less than half of metrics and meeting some performance targets
- Level 6: Improving on less than half of metrics and generally not meeting performance targets
Notes about the school year 2024-2025 SPREE
Starting with the 2022-2023 SPREE cycle, we introduced one-page overview document called the SPOTlight, which provides an at-a-glance summary of school performance and improvement on key SPREE metrics. The SPOTlight provides an overall school-level summary, and the SPREE provides more detailed information about student groups.
In 2024-2025, the SPREE includes information about improvement from prior years (Improving, Maintaining, Not Improving). For District schools’ overall performance, the SPREE also compares performance to annual targets (Meeting 2030 Goal, Meeting, Not Meeting). Because performance is included only for District schools overall, only District schools will receive Level labels for the 2024-2025 SPREE reports.
How Can You Help?
- Talk with your child about the importance and fun of learning to encourage regular attendance — make sure they do not miss more than eight (8) days of school each year.
- Understand your child’s daily schedule and be aware of test dates. Make sure your child is well-rested and prepared.
- Monitor your child’s report card grades and performance on tests throughout the year. Work patiently with them to seek opportunities for improvement where needed.
- Discuss and review your child’s lessons with them to help them remember what they learned.
- Participate in school improvement by taking the Philly School Experience Survey (PSES) each spring. Provide honest feedback about your child’s school and their education, and encourage your child to do the same.
- Work with your School Advisory Council (SAC) to help improve your school’s culture and achievement.
- Enroll your child in credit recovery or summer programs if needed to give them an opportunity to get caught up.
Resources
Business Rules
Metrics by Domain and Report Type
SPREE Family Guide
English | Shqip | 汉语 | عربي | ខ្មែរ | Français | Português | Pусский | Español | Việt
The SPREE Family Guide was last updated for the 2021-2022 reports. Please see the “Notes about the school year 2023-2024 SPREE” section above for current year updates.
SPREE Report Example
- English 2023-2024 | 2021-2022 | 2020-2021
- Shqip 2021-2022 | 2020-2021
- عربي 2024-2023 | 2021-2022 | 2020-2021
- 汉语 2023-2024 | 2021-2022 | 2020-2021
- ខ្មែរ 2021-2022 | 2020-2021
- Français 2021-2022 | 2020-2021
- Kreyòl ayisyen 2023-2024
- Português 2023-2024 | 2021-2022 | 2020-2021
- Pусский 2023-2024 | 2021-2022 | 2020-2021
- Español 2023-2024 | 2021-2022 | 2020-2021
- Uzbek 2023-2024
- українська 2023-2024
- Việt 2023-2024 | 2021-2022 | 2020-2021
User Guide
Other Resources
FAQS
- English 2024-2025 | 2023-2024 | 2022-2023 | 2021-2022 | 2020-2021
- Shqip 2022-2023 | 2021-2022 | 2020-2021
- عربي 2022-2023 | 2021-2022 | 2020-2021
- 汉语 2022-2023 | 2021-2022 | 2020-2021
- ខ្មែរ 2022-2023 | 2021-2022 | 2020-2021
- Français 2022-2023 | 2021-2022 | 2020-2021
- Português 2022-2023 | 2021-2022 | 2020-2021
- Pусский 2022-2023 | 2021-2022 | 2020-2021
- Español 2022-2023 | 2021-2022 | 2020-2021
- Việt 2022-2023 | 2021-2022 | 2020-2021
Previous Framework - SPR 2012-2013 through 2018-2019
Data
- SPR Data 2012-2013 through 2018-2019
- SPR Batch Reports 2012-2013 through 2018-2019
- Trends in Performance on the School Progress Report (SPR) from 2014-15 to 2018-19
- District Scorecard
- SPR Calculator
Resources
- User Guide: 18-19 | 17-18 | 16-17 | 15-16 | 14-15 | 13-14 | 12-13
- Business Rules: 18-19 | 17-18 | 16-17 | 15-16
- Peer Group Generation: 18-19 | 17-18 | 16-17 | 15-16
- SPR Parent Guide: English | Albanian | Arabic | Chinese | French | Khmer | Russian | Spanish | Vietnamese
- FAQs: 18-19 | 17-18 | 16-17 | 15-16 | 14-15 | 13-14 | 12-13
- 2018-2019 SPR Highlights Video
Alternative Education Progress Report (AEPR)
The Alternative Education Progress Report (AEPR) is an innovative tool designed to provide a high-level overview of how our alternative programs are performing. The AEPR reflects our core belief that all students deserve to attend great schools and that we must hold ourselves to a standard of equitable educational excellence. The AEPR enables us to see whether we are meeting this standard.
What is the purpose & use of the AEPR?
Key Features of the AEPR:
- Looks at alternative programs across multiple dimensions, reflecting the unique purposes and designs of these programs
- Evaluates programs against performance targets established in program contracts
- Identifies areas for which programs are near, but not yet reaching, the established targets
Purpose and Use:
- To identify and celebrate successes
- To evaluate performance against contract targets
- To enable evidence-based decisions about intervention, replication, renewal, and expansion
- To track progress against the Action Plan anchor goals
What are the four versions of the AEPR?
There are four different versions of the AEPR, each intended to evaluate performance on metrics that are most relevant to the type of program and its unique purpose:
- Accelerated – programs that allow students who are overage and under-credited to get back on track. Students in accelerated high school programs are able to graduate within three years or less. Students in accelerated middle school programs are able to get back on track and eventually graduate from high school with their age-appropriate cohort.
- AEDY – Alternative Education for Disruptive Youth programs are designed for students who have committed serious Code of Conduct violations. Students enroll in an AEDY Transition program, through disciplinary transfer, after a determination is made through a due process hearing conducted by the Office of Students Rights and Responsibilities. AEDY programs assist such students with transitioning back to non-disciplinary schools.
- Continuation – programs that serve middle grade students in need of smaller school settings that provide intensive academic and social supports
- Dual Enrollment – programs that allow students to earn credits towards their high school diploma and a college degree simultaneously
- Adult Diploma – programs that allow those who are older than 17 years of age (no upper age limit), have earned more than 8 high school credits prior to enrolling, and are not currently enrolled in a regular day school to continue earning credits towards a high school diploma.
Note: In SY2016-2017 and SY2017-2018, all Adult Diploma programs were referred to as EOP programs.
Open Data
In partnership with Open Data Philly, the District publishes data sets spanning various operational school and student performance areas.
Before accessing data, please review the Terms and Conditions.
Are you new to the Open Data site? Take our video tour.
Additional Data Sources
Can’t find what you’re looking for?
Submit a Data Request
Select a subject to view data sets
School Information
School Lists
Click below to view a current Master file of all District, Charter, and Alternative Schools in operation in the School District. Examples of information within the file include: School code, Publication name, School level, Governance, Career and Technical Education (CTE) Status, etc. There is also a Longitudinal file of all District and Charter Schools from 2001-2002 to 2016-2017. Note: Although these school lists are similar, they do not encompass all of the same information. The Longitudinal file is not an appended version of the Master School List.
Last Refreshed: May 2026 | Next Update: Oct 2026
School Year |
File Type |
File Size |
|---|---|---|
SY 2025-2026 |
Excel XLSX |
102 KB |
SY 2025-2026 |
CSV |
140 KB |
SY 2024-2025 |
Excel XLSX |
119 KB |
SY 2024-2025 |
CSV |
160 KB |
SY 2023-2024 |
CSV |
153 KB |
SY 2022-2023 |
CSV |
154 KB |
SY 2021-2022 |
CSV |
163 KB |
SY 2020-2021 |
CSV |
162 KB |
SY 2019-2020 |
CSV |
161 KB |
SY 2018-2019 |
CSV |
161 KB |
SY 2017-2018 |
Excel XLSX |
134 KB |
SY 2001-2002 through SY 2016-2017 |
Excel XLSX |
955 KB |
School Enrollment & Demographics
Click below for files that provide School-level enrollment numbers as of Oct 1st, sorted by school and grade. Student subgroups include All Students, Gender, Ethnicity, and EL, IEP, and CEP status. Student Ethnicity breakouts do not include students with unknown ethnicity; student Gender breakouts do not include non-binary students or students with unknown gender information. Note: School years prior to 2019-2020 do not include Charter Schools.
For more information:
- Visit our interactive Enrollment dashboard to further explore our enrollment data, including annual trends, student demographics, catchment details, and maps.
- View our research reports related to enrollment.
Note: Files for 2014-15 to 2018-19 were reposted in August 2025 to align with current suppression rules.
Last Refreshed: Nov 2025 | Next Update: Nov 2026
School Year |
File Type |
File Size |
|---|---|---|
SY 2025-2026 |
CSV |
479 KB |
SY 2024-2025 |
CSV |
482 KB |
SY 2023-2024 |
CSV |
481 KB |
SY 2022-2023 |
CSV |
446 KB |
SY 2021-2022 |
CSV |
469 KB |
SY 2020-2021 |
CSV |
468 KB |
SY 2019-2020 |
CSV |
467 KB |
SY 2018-2019 |
CSV |
470 KB |
SY 2017-2018 |
CSV |
466 KB |
SY 2016-2017 |
CSV |
457 KB |
SY 2015-2016 |
CSV |
458 KB |
SY 2014-2015 |
CSV |
463 KB |
SY 2013-2014 |
Excel XLSX |
509 KB |
SY 2012-2013 |
Excel XLSX |
552 KB |
SY 2011-2012 |
Excel XLSX |
565 KB |
SY 2010-2011 |
Excel XLSX |
485 KB |
SY 2009-2010 |
Excel XLSX |
580 KB |
All Available Years |
Zip file |
4 MB |
District Enrollment & Demographics
Click below for files that provide District-wide enrollment numbers as of Oct 1st, sorted by grade. Student subgroups include All Students, Gender, Ethnicity, and ELL, IEP, and CEP status. Student Ethnicity breakouts do not include students with unknown ethnicity; student Gender breakouts do not include non-binary students or students with unknown gender information. Note: files for SY 2019-2020 and onward include District, Alternative, Charter and Non Public Special Education enrollment numbers. All data prior to SY 2019-2020 only include District schools.
For more information:
- Visit our interactive Enrollment dashboard to further explore our enrollment data, including annual trends, student demographics, catchment details, and maps.
- View our research reports related to enrollment.
Note: Files for 2014-15 to 2018-19 were reposted in August 2025 to align with current suppression rules.
Last Refreshed: Nov 2025 | Next Update: Nov 2026
School Year |
File Type |
File Size |
|---|---|---|
SY 2025-2026 |
CSV |
13 KB |
SY 2024-2025 |
CSV |
13 KB |
SY 2023-2024 |
CSV |
13 KB |
SY 2022-2023 |
CSV |
12 KB |
SY 2021-2022 |
CSV |
12 KB |
SY 2020-2021 |
CSV |
12 KB |
SY 2019-2020 |
CSV |
13 KB |
SY 2018-2019 |
CSV |
13 KB |
SY 2017-2018 |
CSV |
12 KB |
SY 2016-2017 |
CSV |
12 KB |
SY 2015-2016 |
CSV |
11 KB |
SY 2014-2015 |
CSV |
11 KB |
All Available Years |
Zip file |
50 KB |
Pre-School Information
Click below for information on Pre-K Schools in the Philadelphia School System. Includes School Code, School Name, Address, Phone Number, etc. Note: this data does not include Charter Schools.
Starting 2019-2020, ECH Partners are included. Previous school year files may be updated to reflect the same at a later date.
Last Refreshed: Apr 2025 | Next Update: Spring 2026
School Year |
File Type |
File Size |
Additional Information |
|---|---|---|---|
SY 2023-2024 |
Excel XLSX |
37 KB |
Includes ECH partners
|
SY 2022-2023 |
Excel XLSX |
26 KB |
Includes ECH partners
|
SY 2021-2022 |
CSV |
30 KB |
Includes ECH partners
|
SY 2020-2021 |
CSV |
29 KB |
Includes ECH partners
|
SY 2019-2020 |
CSV |
29 KB |
Includes ECH partners
|
SY 2018-2019 |
CSV |
19 KB |
N/A |
SY 2017-2018 |
Excel XLSX |
28 KB |
N/A |
SY 2013-2014 |
CSV |
20 KB |
Data Information |
All Available Years |
Zip file |
65 KB |
N/A |
Catchment Feeder Schools
An explorer tool for School District schools and their high school feeder catchments can be found at: philasd.explore.avela.org
Select a school to see its information, including the high school feeder catchment.
School Catchment Areas
Click below for files that include the catchment areas for Elementary, Middle, and High Schools. The shapefiles require a Geographic Information System (GIS) software to properly display the school catchment areas.
Notes:
- This data does not include Charter Schools.
- Kensington High School, Kensington CAPA, and Kensington Health Sciences share a catchment area as of 2016-2017, when Kensington HS opened. For this reason, all students living in this area are assigned to the Kensington HS catchment and catchment metrics do not include students attending either CAPA or Health Sciences.
- For the 2013-2014, 2014-2015, and 2015-2016 catchment files on Open Data, Kensington Business (now closed), Kensington Urban (now closed), Kensington CAPA, and Kensington Health shared a catchment area; all students living in the area were assigned to Kensington Business catchment.
Last Refreshed: Oct 2025 | Next Update: Spring 2026
School Year |
File Content |
File Type |
File Size |
|---|---|---|---|
SY 2024-2025 |
Shapefile |
Zip file |
564 KB |
SY 2023-2024 |
Shapefile |
Zip file |
567 KB |
SY 2022-2023 |
Shapefile |
Zip file |
541 KB |
SY 2021-2022 |
Shapefile |
Zip file |
1165 KB |
SY 2020-2021 |
Shapefile |
Zip file |
1163 KB |
SY 2019-2020 |
Shapefile |
Zip file |
610 KB |
SY 2018-2019 |
Shapefile |
Zip file |
613 KB |
SY 2017-2018 |
Shapefile |
Zip file |
725 KB |
SY 2016-2017 |
Shapefile |
Zip file |
723 KB |
SY 2015-2016 |
Shapefile |
Zip file |
716 KB |
SY 2014-2015 |
Shapefile |
Zip file |
967 KB |
SY 2013-2014 |
Shapefile |
Zip file |
502 KB |
SY 2012-2013 |
Shapefile |
Zip file |
733 KB |
All Available Years |
Shapefile |
Zip file |
8.7 MB |
SY 2021-2022 |
Google Keyhole
|
KMZ |
276 KB |
SY 2020-2021 |
Google Keyhole
|
KMZ |
277 KB |
SY 2019-2020 |
Google Keyhole
|
KMZ |
282 KB |
School Catchment Retention Details
Click below for files that include catchment retention details for district, charter, and alternative schools. The Catchment Retention Details report provides enrollment and catchment related details for each school for students enrolled on October 1 of that year.
The files correspond to the Catchments tab on the interactive Enrollment data website.
Visit our interactive Enrollment data website to further explore our enrollment data, including annual trends, student demographics, catchment details, and maps.
Notes:
- Data reflect students’ last recorded address in the District’s student information system at the time of the enrollment snapshot.
- This data does not include Non Public Special Education schools.
- Kensington High School, Kensington CAPA, and Kensington Health Sciences share a catchment area as of 2016-2017, when Kensington HS opened. For this reason, all students living in this area are assigned to the Kensington HS catchment and catchment metrics do not include students attending either CAPA or Health Sciences.
Last Refreshed: Dec 2025 | Next Update: Dec 2026
School Year |
File Type |
File Size |
|---|---|---|
SY 2025-2026 |
CSV |
36 KB |
SY 2024-2025 |
CSV |
38 KB |
SY 2023-2024 |
CSV |
36 KB |
SY 2022-2023 |
CSV |
37 KB |
SY 2021-2022 |
CSV |
44 KB |
SY 2020-2021 |
CSV |
43 KB |
SY 2019-2020 |
CSV |
45 KB |
SY 2018-2019 |
CSV |
40 KB |
SY 2017-2018 |
CSV |
39 KB |
SY 2016-2017 |
CSV |
39 KB |
School Catchment Retention Counts
Click below for files that include catchment retention counts grouped by school or by catchment area for students enrolled on October 1 of that year. Both report types include district, charter, and alternative schools.
The files correspond to the Catchments tab on the interactive Enrollment data website.
Visit our interactive Enrollment data website to further explore our enrollment data, including annual trends, student demographics, catchment details, and maps.
Notes:
- Data reflect students’ last recorded address in the District’s student information system at the time of the enrollment snapshot.
- This data does not include Non Public Special Education schools.
- Kensington High School, Kensington CAPA, and Kensington Health Sciences share a catchment area as of 2016-2017, when Kensington HS opened. For this reason, all students living in this area are assigned to the Kensington HS catchment and catchment metrics do not include students attending either CAPA or Health Sciences.
Last Refreshed: Dec 2025 | Next Update: Dec 2026
School Year |
Data Type |
File Type |
File Size |
|---|---|---|---|
SY 2025-2026 |
Counts by School |
CSV |
1.4 MB |
SY 2024-2025 |
Counts by School |
CSV |
1.3 MB |
SY 2023-2024 |
Counts by School |
CSV |
1 MB |
SY 2022-2023 |
Counts by School |
CSV |
1 MB |
SY 2021-2022 |
Counts by School |
CSV |
1 MB |
SY 2020-2021 |
Counts by School |
CSV |
1 MB |
SY 2019-2020 |
Counts by School |
CSV |
1 MB |
SY 2018-2019 |
Counts by School |
CSV |
1 MB |
SY 2017-2018 |
Counts by School |
CSV |
1 MB |
SY 2016-2017 |
Counts by School |
CSV |
1 MB |
SY 2025-2026 |
Counts by Catchment |
CSV |
1.4 MB |
SY 2024-2025 |
Counts by Catchment |
CSV |
1.3 MB |
SY 2023-2024 |
Counts by Catchment |
CSV |
1 MB |
SY 2022-2023 |
Counts by Catchment |
CSV |
1 MB |
SY 2021-2022 |
Counts by Catchment |
CSV |
1 MB |
SY 2020-2021 |
Counts by Catchment |
CSV |
1 MB |
SY 2019-2020 |
Counts by Catchment |
CSV |
1 MB |
SY 2018-2019 |
Counts by Catchment |
CSV |
1 MB |
SY 2017-2018 |
Counts by Catchment |
CSV |
1 MB |
SY 2016-2017 |
Counts by Catchment |
CSV |
1 MB |
Philly School Experience Survey (PSES)
Click below to download a Zip file that contains Student, Parent/Guardian, Teacher, Principal, and Support Staff results and response rates from the Philly School Experience Survey. Note that data for each respondent group or level of aggregation (i.e. school, network, sector) is available only when a minimum response rate threshold is met.
Cross-Sectional data files: These files are for those interested in responses to particular questions in a given year. The files display the number and percentage of respondents selecting each response option for each question. For 2021-2022 and after, the results are aggregated by school, network, sector, and for all respondents. Prior to 2021-2022, the results are aggregated by school only. To download all years, select “All Available Years.”
Topic & Subtopic Scores data files: These files provide topic and subtopic scores for all key topics and subtopics and years for which scores are currently comparable to the most recent year. Some scores are not available for some years because questions or response scales in that topic or subtopic have changed.
For longitudinal data, please see our process for submitting a data request.
For more information:
- Visit our interactive Philly School Experience Survey dashboard to further explore survey data, including Board Goals and Guardrails highlights, topic and subtopic details, responses to individual questions, and survey response rates.
- Visit the Philly School Experience Survey home page for technical documentation, research reports, printable school summaries, and more.
Last Update: Sep 2025 | Next Refresh: Sep 2026
School Year |
Observation Type |
File Type |
File Size |
Additional Info |
|---|---|---|---|---|
SY 2019-2020 to 2024-2025 |
Topic & Subtopic Scores |
Zip file |
2 MB |
|
SY 2024-2025 |
Cross-Sectional |
Zip file |
7 MB |
|
SY 2023-2024 |
Cross-Sectional |
Zip file |
5 MB |
|
SY 2022-2023 |
Cross-Sectional |
Zip file |
5 MB |
|
SY 2021-2022 |
Cross-Sectional |
Zip file |
6 MB |
|
SY 2020-2021 |
Cross-Sectional |
Zip file |
4 MB |
|
SY 2019-2020 |
Cross-Sectional |
Zip file |
4 MB |
|
SY 2018-2019 |
Cross-Sectional |
Zip file |
4 MB |
Erratum |
SY 2017-2018 |
Cross-Sectional |
Zip file |
4 MB |
|
SY 2016-2017 |
Cross-Sectional |
Zip file |
5 MB |
|
SY 2015-2016 |
Cross-Sectional |
Zip file |
4 MB |
|
SY 2014-2015 |
Cross-Sectional |
Zip file |
3 MB |
|
All Available Years |
All |
Zip file |
49 MB |
Erratum |
Youth Risk Behavior Survey (YRBS)
This file contains data from the Youth Risk Behavior Study (YRBS) administered in Philadelphia and includes anonymous responses from a random sample of students in grades 9-12.
Notes:
- The survey codebook is necessary to interpret the results and is available in Data Information.
- In accordance with CDC requirements, data does not include school identifiers.
For more information:
- Visit the CDC’s YRBSS website to learn about survey administrations across the country.
- Visit our Youth Risk Behavior Survey home page for research reports, printable posters and brochures, and more.
Last Update: 2026 | Next Refresh: 2028
Year |
File Type |
File Size |
Additional Information |
|---|---|---|---|
2025 |
Excel XLSX |
1 MB |
Data Information |
2023 |
Excel XLSX |
.9 MB |
Data Information |
2021 |
Excel XLSX |
1.1 MB |
Data Information |
2019 |
Excel XLSX |
1.0 MB |
Data Information |
2017 |
Excel XLSX |
1.3 MB |
Data Information |
2015 |
Excel XLSX |
1.5 MB |
Data Information |
2013 |
Excel XLSX |
1 MB |
Data Information |
School Reopening Information
School Reopening Survey
Click below to download a Zip file that contains respondent level student, parent/guardian/community member, and school-based/central office SDP staff response data from the School Reopening survey.
Hybrid vs. Digital Curriculum Selection
Click below for the results of the Phase 1 enrollment in hybrid or digital curriculum. Phase 1 included grades PreK through 2 in District schools and Early Childhood programs only.
Last Update: Dec 2020
Date |
Data Type |
File Type |
File Size |
Data Information |
|---|---|---|---|---|
June 2020 |
School Reopening Survey |
Zip file |
9.7MB |
Survey Questionnaires |
November 2020 |
Hybrid Learning Selection |
Excel XLSX |
120 KB |
N/A |
School Selection
School Selection – Application Details: The Application Details files contain, for each sending and receiving school pair, the number of student applications, number of program offers, and number of student acceptances for all criteria-based and citywide admission schools in the School District of Philadelphia.
School Selection – Applicant Demographics: The Applicant Demographics files include district and school level applicant data by applicant demographics.
For more information, view our research reports related to school selection.
Last Update: Jan 2025 | Next Update: Dec 2025
School Year |
Data Type |
File Type |
File Size |
Additional Information |
|---|---|---|---|---|
2024-2025 |
Application Details |
CSV |
642 KB |
|
2023-2024 |
Application Details |
CSV |
608 KB |
|
2022-2023 |
Application Details |
CSV |
739 KB |
|
2021-2022 |
Application Details |
CSV |
455 KB |
Data Information |
2020-2021 |
Application Details |
CSV |
565 KB |
|
2019-2020 |
Application Details |
CSV |
591 KB |
|
2018-2019 |
Application Details |
CSV |
565 KB |
|
2017-2018 |
Application Details |
CSV |
554 KB |
|
2024-2025 |
Applicant Demographics |
XLSX |
67 KB |
|
2023-2024 |
Applicant Demographics |
XLSX |
66 KB |
|
2022-2023 |
Applicant Demographics |
XLSX |
68 KB |
Erratum |
2021-2022 |
Applicant Demographics |
XLSX |
67 KB |
|
2020-2021 |
Applicant Demographics |
XLSX |
72 KB |
|
2019-2020 |
Applicant Demographics |
XLSX |
72 KB |
|
2018-2019 |
Applicant Demographics |
XLSX |
72 KB |
School Meal Participation
Click below for a longitudinal file that contains school-level information about average yearly rates of student participation in school meals programs.
These rates are calculated using publicly available information from the Pennsylvania Department of Education about school meal distributions, as well as District enrollment and attendance data.
School-level data are provided for District schools for school years 2013-14 through 2019-20. Please note that the 2020-21 and 2021-22 school years are unavailable due to COVID-related school closures.
The data includes school year, ULCS code, site ID, school name, student enrollment, average daily attendance rate, number of reachable students, average number of breakfasts and lunches served per day, and calculated breakfast and lunch participation rates. A Notes tab contains further description of the data sources and calculations that are provided in the data file.
For more information, view our research reports related to school breakfast.
Last update: Feb 2026 | Next update: Spring 2027
School Year |
File Type |
File Size |
|---|---|---|
2013-2014 through 2024-2025 |
Excel XLSX |
290 KB |
Household Food Security
Click below for files that contain school-level information about household food security status. This information is based on responses to questions about food security that appear on the parent/guardian Philly School Experience Survey (PSES). All schools that met the minimum response rate threshold for the parent/guardian survey are included. The data includes ULCS code, school name, survey response rate, the number of respondents who answered questions about food security, and the number and percentage of respondents who were classified as having very low food security, low food security, and high or marginal food security.
Additional tabs contain a description of the methods used to classify household food security as well as information about the specific PSES questions used for this purpose.
Food security classifications were assigned according to procedures published by the USDA. For more information about food security categories, refer to the USDA website here.
For more information:
- Visit the Philly School Experience Survey home page.
- View our research reports related to health & nutrition.
Last Update: Dec 2025 | Next Update: Dec 2026
School Performance
School Progress Report on Education and Equity
File structured as one row per school-report-metric from the School Progress Report on Education and Equity (SPREE). Example metrics include: Student Attendance, Graduation Rates, and PSSA/Keystone results. Use the link in the sidebar to view more information about the SPREE.
Visit our interactive SPREE dashboard to further explore school performance data, including trends (forthcoming), individual metric scores for schools and subgroups, maps, and an online version of the school reports.
Note: In spring 2026, a rounding issue was found to impact 2023-2024 student attendance data at a small number of charter schools. The 2024-2025 Open Data file was updated in April 2026 to incorporate the updated prior-year data and year-over-year change.
Last Refreshed: Apr 2026 | Next Update: Spring 2027
School Progress Report (previous framework)
File structured as one row per school-report from the School Progress Report. Example Metrics include: PSSA Math Prof/Adv, Retention, Out of School Suspension, Graduate, Attendance. Use the link in the sidebar to view individual School Progress Reports.
For more information:
- Visit our interactive SPR dashboard to further explore school performance data, including annual trends, domain and metric scores, maps, an online version of the school reports, and the SPR Calculator.
- View our research reports related to the SPR.
Last Refreshed: Feb 2020 | Next Update: Discontinued
School Year |
File Type |
File Size |
Additional Information |
|---|---|---|---|
SY 2018-2019 |
Excel XLSX |
892 KB |
Data Information |
SY 2017-2018 |
Excel XLSX |
859 KB |
Data Information |
SY 2016-2017 |
Excel XLSX |
736 KB |
Data Information |
SY 2015-2016 |
Excel XLSX |
773 KB |
Data Information |
SY 2014-2015 |
Excel XLSX |
753 KB |
Data Information |
SY 2013-2014 |
Excel XLS |
643 KB |
Data Information |
SY 2013-2014
|
Excel XLSX |
9 KB |
Data Information |
SY 2012-2013 |
CSV |
389 KB |
Data Information |
SPR Year-over-Year |
Excel XLSX |
11 MB |
N/A |
All Available Years |
Zip file |
7.0 MB |
N/A |
District SPOTlight
Access the District SPOTlight below, a summary of district-wide performance outcomes on key measures. The SPOTlight was first released after the 2022-2023 school year and contains data starting from SY2021-2022.
Note: This data does not include Charter Schools.
Previously, district-wide outcomes were summarized on the District Scorecard, which remains available but is no longer being updated. SY2019-2020 data was limited due to the onset of the COVID-19 pandemic in March 2020, so a limited summary of outcomes for that year is also available in an archived format here.
Last Refreshed: Apr 2024 | Next Update: Spring 2025
Alternative Education Progress Report
File that includes program results from the Alternative Education Progress Report. Example metrics include: Credit Accumulation, Annual Graduation, Attendance.
For more information, view our research reports related to the AEPR.
Last Refreshed: Jul 2025 | Next Update: Jul 2026
School Year |
File Type |
File Size |
Additional Information |
|---|---|---|---|
SY 2023-2024 |
Excel XLSX |
69 KB |
Data Information |
SY 2022-2023 |
Excel XLSX |
72 KB |
Data Information |
SY 2021-2022 |
Excel XLSX |
95 KB |
Data Information |
SY 2020-2021 |
Excel XLSX |
90 KB |
Data Information |
SY 2019-2020 |
Excel XLSX |
59 KB |
Data Information |
SY 2018-2019 |
Excel XLSX |
68 KB |
Data Information |
SY 2017-2018 |
Excel XLSX |
74 KB |
Data Information |
SY 2016-2017 |
Excel XLSX |
12 MB |
Data Information |
PSSA & Keystone Exam Data
Performance on the Pennsylvania System of School Assessment (PSSA) for all district schools by grade. Performance is provided as counts and percentage for Below Basic, Basic Proficient, Advanced, and Proficient/Advanced scores. The following subgroups are also provided: English Language Learner (ELL), Special Education (IEP) status, Gender, Ethnicity, and Economically disadvantaged.
Data is disaggregated by category (e.g., Gender) and group (e.g., Female). Information is suppressed (and a letter “s” appears) if the number of students in the group (the denominator) is fewer than 20. If only one group within a category has fewer than 20 students, the data for the next-smallest group within the category is also suppressed.
As part of Pennsylvania’s transition to the new STEELS standards (Science, Technology & Engineering, Environmental Literacy & Sustainability), the 2025 PSSA Science assessment was administered as a census field test to students in grades 5 and 8. Consequently, PSSA Science results for elementary and middle school students are not available for SY 2024-2025. The data from the 2025 field test will be used to produce the 2026 PSSA Science assessments.
An important note about results for SY 2019-2020 and SY 2020-2021: Due to COVID-19 school closures, the PSSA and Keystone exams were not administered in Spring 2020 (for SY 2019-20). In SY 2020-21, due to the continued COVID-19 pandemic, students were 100% virtual for most of the school year. SY 2020-21 PSSA & Keystone participation was low, and therefore, results are not published here. To learn more about district-wide assessments administered in SY 2020-2021, view this issue brief.
Notes:
- This data does not include Charter Schools.
- This data includes PASA tests.
For more information:
- Visit our interactive PSSA/Keystone dashboard to further explore our performance data, including annual trends, breakouts by subgroups, disproportionality, and maps.
- View our research reports related to PSSA and Keystone exams.
Last Refreshed: Feb 2026 | Next Update: Nov 2026
School Year |
File Type |
File Size |
|---|---|---|
SY 2024-2025 |
Zip file |
0.7 MB |
SY 2023-2024 |
Zip file |
0.8 MB |
SY 2022-2023 |
Zip file |
0.8 MB |
SY 2021-2022 |
Zip file |
0.8 MB |
SY 2020-2021
|
|
|
SY 2019-2020
|
|
|
SY 2018-2019 |
Zip file |
4 MB |
SY 2017-2018 |
Zip file |
4 MB |
SY 2016-2017 |
Zip file |
6 MB |
SY 2015-2016 |
Zip file |
7 MB |
SY 2014-2015 |
Zip file |
7 MB |
SY 2013-2014 |
Zip file |
9.5 MB |
SY 2012-2013 |
Zip file |
7 MB |
SY 2011-2012 |
Zip file |
7 MB |
SY 2010-2011 |
Zip file |
7.6 MB |
SY 2009-2010 |
Zip file |
8 MB |
All Available Years |
Zip file |
72 MB |
District Graduates by Act 158 Pathway
Beginning with the graduating class of 2022-2023, students in Pennsylvania are required to demonstrate postsecondary preparedness in order to graduate from high school. Students can graduate via one of five pathways, or by meeting goals and objectives (for special education students only), or through a waiver (in limited circumstances).
This report, published by the Pennsylvania Department of Education on the Future Ready Index site, presents the number and percentage of students graduating via each pathway. The most recent year’s report can also be found on the Philadelphia City School District’s Future Ready Index page (at the bottom, under Graduation Report).
The report is based on information submitted by the School District of Philadelphia to PDE each winter. Per PDE’s reporting requirements, students are counted toward the first pathway for which they have completed the requirements, going in order from Pathway 1–5 (e.g., a student who has met the requirements for both Pathway 2 and Pathway 4 is included in the Pathway 2 category). This report includes students at both traditional District schools and Alternative programs.
Note: The number of students eligible to graduate, and the number and percentage graduating, follow specific reporting rules and differ from other graduation rate reporting (e.g., the Four-Year Cohort Graduation Rate).
Last Refreshed: Dec 2025 | Next Update: Dec 2026
School Year |
File Type |
File Size |
|---|---|---|
SY 2024-2025 |
|
143 KB |
SY 2023-2024 |
|
140 KB |
SY 2022-2023 |
|
140 KB |
School Graduates by Act 158 Pathway
Beginning with the graduating class of 2022-2023, students in Pennsylvania are required to demonstrate postsecondary preparedness in order to graduate from high school. Students can graduate via one of five pathways, or by meeting goals and objectives (for special education students only), or through a waiver (in limited circumstances).
The data in this file is based on information submitted by the School District of Philadelphia to PDE each winter. Per PDE’s reporting requirements, students are counted toward the first pathway for which they have completed the requirements, going in order from Pathway 1–5 (e.g., a student who has met the requirements for both Pathway 2 and Pathway 4 is included in the Pathway 2 category).
Note: The number of students eligible to graduate, and the number and percentage graduating, follow specific reporting rules and differ from other graduation rate reporting (e.g., the Four-Year Cohort Graduation Rate).
Last Refreshed: Apr 2026 | Next Update: Feb 2027
School Year |
File Type |
File Size |
|---|---|---|
SY 2024-2025 |
CSV |
123 KB |
SY 2023-2024 |
CSV |
209 KB |
SY 2022-2023 |
CSV |
200 KB |
District Graduation Rate
This longitudinal open data file includes information about the graduation rates for the district broken out by: aggregation level (including alternative schools or excluding alternative schools), graduation rate type (four-year, five-year, or six-year), demographic category (EL status, IEP status, Economically Disadvantaged Status, Gender, or Ethnicity), and 9th grade cohort.
The “Graduation Rate – Including Alternative Schools” includes traditional District K-12 schools, alternative education schools, Philadelphia Virtual Academy, and Widener Memorial School. The “Graduation Rate – Excluding Alternative Schools” includes traditional District K-12 schools, Philadelphia Virtual Academy, and Widener Memorial School only.
Students are attributed to the last school at which they actively attended in the respective graduation window, which ends on September 30 each year. Students are classified as EL, as having an IEP, and/or economically disadvantaged if they were designated as such at any point during their high school career. This file includes information for all 9th grade cohorts dating back to the 2010-2011 9th grade cohort.
For more information:
- Visit our interactive College & Career dashboard to further explore our 9th grade on track, high school graduation, college matriculation and persistence data, including breakouts by subgroups, student grades, and type of college students enrolled in.
- View our research reports related to high school graduation.
Last Refreshed: Feb 2026 | Next Update: Spring 2027
School Year |
9th Grade
|
File Type |
File Size |
|---|---|---|---|
SY 2013-2014
|
SY 2010-2011
|
CSV |
124 KB |
Special note: The 2017-2018 “Four-Year Cohort Graduation Rate – Excluding Alternative Schools” published on the District Scorecard did not include students who were last enrolled at a school that closed before the 2017-2018 school year. If it had, the 2017-2018 rate would have been 78% (rounded to the nearest integer). This open data file correctly identifies that the 4-Year Graduation Rate (Excluding Alternative Schools) for all students in the 2014-2015 cohort is 78.39%.
School Graduation Rates
This longitudinal open data file includes information about the graduation rates for schools broken out by: graduation rate type (four-year, five-year, or six-year), demographic category (EL status, IEP status, Economically Disadvantaged Status, Gender, or Ethnicity), and 9th grade cohort. Students are attributed to the last school at which they actively attended in the respective graduation window, which ends on September 30 each year. Students are classified as EL, as having an IEP, and/or economically disadvantaged if they were designated as such at any point during their high school career.
This file includes information for all 9th grade cohorts dating back to the 2010-2011 9th grade cohort. Previously published graduation Open Data files for earlier cohorts can be found in the Zip file archive.
Note: This data does not include Charter Schools.
For more information:
Visit our interactive College & Career dashboard to further explore our 9th grade on track, high school graduation, college matriculation and persistence data, including breakouts by subgroups, student grades, and type of college students enrolled in.
View our research reports related to high school graduation.
Last Refreshed: Feb 2026 | Next Update: Spring 2027
School Year |
9th Grade
|
File Type |
File Size |
|---|---|---|---|
SY 2013-2014
|
SY 2010-2011
|
CSV |
3.7 MB |
SY 2009-2010
|
SY 2006-2007
|
Zip file |
550 KB |
Aimsweb-Star
The files include, at the school level, the distribution of students across performance tiers based on the aimswebPlus and Star assessments, which measure student’s reading and math skills.
Starting in 2020-21, aimswebPlus was required for students in grades K-5, and Star was required for students in grades 6-8. Special education students who were not exempted in their Individualized Education Plans (IEPs) took aimswebPlus in grades K-5, aimswebPlus and Star in grades 6-8, and Star in grades 9-12.
Starting in 2021-22, aimswebPlus was replaced by Star for students in all grades.
Note: Percentile rank cut scores for performance tiers have changed over time. This happened because Renaissance’s renormed the Star assessments, and SDP then analyzed internal data to set new cut scores that approximate the previous ones. Because of these changes, use caution when comparing performance over time.
To see SDP’s percentile rank cut scores for Star performance (as of SY2024-25), broken out by subject and grade level, click here. Cut scores for previous years are available here.
For more information:
- Visit our interactive Goals & Guardrails Progress Monitoring dashboard to explore historic district-level performance by grade level and subgroup on Star Reading and Star Math, leading indicators for Board Goals 1-4.
- View our research reports related to aimswebPlus and Star.
Aimsweb: Last Refreshed: Feb 2021 | Next Update: Discontinued
Star: Last Refreshed: Sep 2025 | Next Update: Sep 2026
School Year |
Assessment |
File Type |
File Size |
Additional Information |
|---|---|---|---|---|
SY 2021-2022
|
Star Reading & Math |
CSV |
8 KB |
Read me |
SY 2021-2022
|
Star CBM |
CSV |
4 KB |
Read me |
SY 2019-2020
|
Aimsweb Reading |
CSV |
26 KB |
|
SY 2020-2021 |
Aimsweb Math |
CSV |
13 KB |
|
SY 2019-2020
|
Star Reading |
CSV |
29 KB |
|
SY 2019-2020
|
Star Math |
CSV |
29 KB |
Attendance
The 90% Attendance and Average Daily Attendance (ADA) within month files update quarterly. They are calculated by month at the District level, and each month is calculated mutually exclusive from other months.
The Average Daily Attendance (ADA) calculation aggregates the absences for all students recorded in the Student Information System (SIS) and compares them to the total number of possible attended days based on the enrollment records of each student at the school. All classifications and reasons for student absences are included in calculating the absences used to calculate ADA.
The 95% Attendance (District- and School-Level) files display the number and percentage of enrolled students in each grade that attended at least 95% of instructional days. The 95% Attendance – District file updates quarterly and is calculated cumulatively by month at the District level; the rate listed for June (except SY2019-20; see footnote 4) is the official year-end number for reporting and accountability purposes. The 95% Attendance – School is calculated cumulatively at year-end at the school level. All classifications and reasons for student absences are included in calculating absences used to calculate 95% Attendance.
Notes:
- These data sets do not include Charter Schools.
- Data only includes students enrolled in the District/school for 10 or more days.
- Summing numerators and denominators in the school-level file will not result in the numbers listed in the District-level file. This is because the figures in the school file are school-specific, meaning (a) a student who transfers schools mid-year will generally be attributed to both schools in the school file, but only counted once in the District file; and (b) a student may have a 95% attendance rate at one school but a less-than-95% attendance rate when considering their attendance across all schools
- All Attendance file calculations for SY2019-2020 only consider data through March 13, 2020 due to state-wide COVID-19 school closures.
- Previously published files are available as a ZIP file archive.
- Due to retroactive cleaning of the data, subtle differences may occur between newly uploaded data files.
For more information:
- See our attendance explainer, How does the School District of Philadelphia calculate student attendance?
- View our research reports related to attendance.
90% Attendance within month – District: Last Refreshed: May 2026 | Next Update: Aug 2026
90% Attendance – School: Last Refreshed: Feb 2026 | Next Update: Spring 2027
ADA within month – District: Last Refreshed: May 2026 | Next Update: Aug 2026
ADA – School: Last Refreshed: Feb 2026 | Next Update: Spring 2027
95% Attendance cumulative by month – District: Last Refreshed: May 2026 | Next Update: Aug 2026
95% Attendance – School: Last Refreshed: Feb 2026 | Next Update: Spring 2027
School Year |
Attendance Type |
Aggregation Type |
Time Frame |
File Type |
File Size |
|---|---|---|---|---|---|
SY 2020-2021
|
90% Attendance
|
District-Level |
Month |
CSV |
82 KB |
SY 2020-2021
|
90% Attendance |
School-Level |
Year |
CSV |
1.3 MB |
SY 2020-2021
|
Average Daily Attendance
|
District-Level |
Month |
CSV |
68 KB |
SY 2020-2021
|
Average Daily Attendance |
School-Level |
Year |
CSV |
58 KB |
SY 2020-2021
|
95% Attendance
|
District-Level |
Month |
CSV |
83 KB |
SY 2020-2021
|
95% Attendance |
School-Level |
Year |
CSV |
1.3 MB |
Previously
|
Archive |
District/School |
Month/Year |
ZIP |
273 KB |
Out-of-School Suspensions
The Out-of-School Suspensions (District– and School-Level) files display the number and percent of enrolled students in each grade that had out-of-school suspensions (OSS). The OSS – District file updates quarterly and is calculated cumulatively by month at the District level; the rate listed for June (except SY2019-20; see footnote 4) is the official year-end number for reporting and accountability purposes. The OSS – School file is calculated cumulatively at year-end at the school level.
Notes:
- This data does not include Charter Schools.
- Data only includes students enrolled in the District/school for 10 or more days.
- Summing numerators and denominators in the school-level file will not result in the numbers listed in the District-level file. This is because the figures in the school file are school-specific, meaning (a) a student who transfers schools mid-year will generally be attributed to both schools in the school file, but only counted once in the District file; and (b) a student may have zero suspensions at one school but one or more suspensions at a different school, and thus be excluded from the count of students with zero OSS at the District level.
- All OSS calculations for SY2019-2020 only consider data through March 13, 2020 due to state-wide COVID-19 school closures.
- Previously published files are available as a ZIP file archive.
- Due to retroactive cleaning of the data, subtle differences may occur with newly uploaded data files.
OSS – School: Last Refreshed: Feb 2026 | Next Update: Spring 2027
OSS – District: Last Refreshed: May 2026 | Next Update: Aug 2026
School Year |
Aggregation Type |
Time Frame |
File Type |
File Size |
|---|---|---|---|---|
SY 2019-2020
|
School-Level |
Year |
CSV |
2 MB |
SY 2020-2021
|
District-Level |
Month |
CSV |
118 KB |
Previously
|
School-Level |
Year |
Zip file |
389 KB |
Serious Incidents
Serious Incidents are incidents reported to the Office of School Safety. The Counts by Incident Type files provide the number of reported incidents at a school, by incident type. The Incident Report Details updates quarterly and provides detailed information about the reported incidents. Some incident types are included in the Counts by Incident Type file but excluded from the Incident Report Details file due to their sensitive nature.
Definitions for many of the serious incidents reported in these files can be found in the Appendix of the Code of Conduct.
Notes:
- This data does not include Charter Schools.
- Due to retroactive cleaning of the data, subtle differences may occur for new data file uploads.
- Previously published files are available as a ZIP file archive.
Incident Counts: Last Refreshed: Feb 2026 | Next Update: Spring 2027
Incident Details: Last Refreshed: May 2026 | Next Update: Aug 2026
School Year |
Data Type |
File Type |
File Size |
|---|---|---|---|
SY 2020-2021
|
Counts by
|
CSV |
492 KB |
SY 2020-2021
|
Incident Report
|
CSV |
3.5 MB |
Previously published
|
Archive Counts
|
ZIP |
375 KB |
Previously published
|
Archive Incident
|
ZIP |
682 KB |
College Applications
College application data reflects the number and percentage of 12th graders submitting 1+ college applications. Data is self-reported in the District’s college and career readiness platform, Xello. The college application data file updates twice a year, reflecting applications as of a midyear checkpoint and end-of-year checkpoint. For 2025-2026, the midyear checkpoint reflects data from April.
Last Refreshed: May 2026 | Next Update: Jul 2026
Reporting Year |
Midyear |
End-of-year |
|---|---|---|
2025-26 |
Midyear Data |
NSC Student Tracker Reports
Click on the Reporting Cycle below to download a Zip folder that contains National Student Clearinghouse Student Tracker Reports for individual schools and the District as a whole. These reports contain data on student post-secondary enrollment, persistence, and graduation.
Please use our School NSC Code Crosswalk to identify the NSC code for the school report and year you want to view. The NSC code is found in the third component of each report file name, after “HS”. For example a report for the school with NSC code 392779 will appear as follows: “4218990hs_10000345_HS392779…”
The District does not share student academic or demographic information with the NSC. Therefore, the NSC is unable to generate many of the subgroup analyses contained in the Academic and Demographic reports (i.e., these report types are mostly left blank).
Note: District reports include data for District, Charter, and Alternative schools.
Last Refreshed: May 2026 | Next Update: Sep 2026
Reporting Year |
H.S. Class of: |
Fall Reports |
Spring Reports |
Summer Reports |
|---|---|---|---|---|
2025-2026 |
2018-2025 |
November 2025 |
April 2026 |
|
2024-2025 |
2017-2024 |
November 2024 |
April 2025 |
August 2025 |
2023-2024 |
2016-2023 |
November 2023 |
April 2024 |
August 2024 |
2022-2023 |
2015-2022 |
November 2022 |
April 2023 |
August 2023 |
2021-2022 |
2014-2021 |
November 2021 |
April 2022 |
August 2022 |
2020-2021 |
2013-2020 |
November 2020 |
April 2021 |
N/A |
2019-2020 |
2012-2019 |
November 2019 |
April 2020 |
August 2020 |
2018-2019 |
2011-2018 |
November 2018 |
April 2019 |
August 2019 |
2017-2018 |
2010-2017 |
November 2017 |
N/A |
August 2018 |
2016-2017 |
2009-2016 |
November 2016 |
April 2017 |
August 2017 |
2015-2016 |
2008-2015 |
N/A |
N/A |
August 2016 |
2014-2015 |
2007-2014 |
November 2014 |
April 2015 |
August 2015 |
College Matriculation
This file includes information on the fall matriculation rates for students who graduated during the school year indicated (e.g., 2019-2020 matriculation rates represent enrollment of students who graduated during 2019-2020). Students are considered to have matriculated if they enrolled at a postsecondary institution that reports information to the National Student Clearinghouse (NSC).
Note: This data does not include Charter or Alternative Schools.
For more information:
- Visit our interactive College & Career dashboard to further explore our 9th grade on track, high school graduation, college matriculation and persistence data, including breakouts by subgroups, student grades, and type of college students enrolled in.
- View our research reports related to college & career.
Last Refreshed: Feb 2026 | Next Update: Spring 2027
School Year |
File Type |
File Size |
|---|---|---|
SY 2024-2025 |
CSV |
3 KB |
SY 2023-2024 |
CSV |
3 KB |
SY 2022-2023 |
CSV |
3 KB |
SY 2021-2022 |
CSV |
3 KB |
SY 2020-2021 |
CSV |
3 KB |
SY 2019-2020 |
CSV |
3 KB |
End of Year Report
Wide-School file that includes schools results from the 2019-2020 End-of-Year Report. Example Metrics include: Credit Accumulation, Out of School Suspensions, Graduation Rates, Attendance.
Due to the COVID-19 pandemic and associated school closures, multiple state and local assessments were cancelled during the 2019-2020 school year. As a result, the School District of Philadelphia is not able to release a scored School Progress Report for the 2019-2020 school year. Instead, the District will release an unscored end-of-year summary report for each school to share information on the metrics that are available for the 2019-20 school year. The full reports were released in January 2021 and are available at the bottom of this page. Please see below for a list of metrics that are included in the end-of year summary, by domain.
Achievement
- % of English Learners scoring at or above a 4.5 on the ACCESS for ELLs 2.0 assessment (District schools only)
Progress
- % of on-track students earning the credits required for promotion (grades 9-11 only)
- % of off-track students earning the credits required for promotion (grades 9-11 only)
- % of English Learners meeting the individual growth target on the ACCESS for ELLs 2.0 assessment (District schools only)
Climate
- % of students attending 95%+ of instructional days, 90-95% of instructional days, 85-90% of instructional days, 80-85% of instructional days, or less than 80% of instructional days (calculated through March 13, 2020 only)
- % of students with zero out-of-school suspensions (calculated through March 13, 2020 only)
- % of students with zero in-school suspensions (calculated through March 13, 2020 only)
- District-wide Survey: Student climate rating
- District-wide Survey: Student participation rate
- District-wide Survey: Parent/guardian participation rate
- District-wide Survey: Parent/guardian climate rating
College & Career
- Four-year cohort graduation rate
- District-wide Survey: Student college & career readiness rating
Educator Effectiveness
- % of teachers attending 95%+ of days (District schools only)
- District-wide Survey: Student perception of quality of teacher practice
Published: Jan 2021
EOY Resource Files |
File Type |
File Size |
Additional Information |
|---|---|---|---|
SY 2019-2020 |
Excel |
329 KB |
Data Information |
Individual School Reports |
|
||
FAQ |
|
403 KB |
N/A |
Business Rules |
|
374 KB |
N/A |
2019-2020 Scorecard |
|
132 KB |
N/A |
District Employees and Finance
Expenditure Information
Information includes: Vendor identifier and name, Activity Name, Amount of Expenditures Spent, etc. The data set covers the Fiscal Year calendar, starting from July 1st and ending on June 30th. Please note that this data set was erroneously labeled as a Calendar Year data set from January 1st to December 31st prior to the FY 2022 file upload. We apologize for any confusion this may have caused and have updated the labels and provided the README files for each data file to accurately reflect its contents.
Last Refreshed: Jan 2026 | Next Update: Jan 2027
Fiscal Year |
File Type |
File Size |
|---|---|---|
2025 Fiscal Year |
ZIP |
578 KB |
2024 Fiscal Year |
ZIP |
522 KB |
2023 Fiscal Year |
ZIP |
475 KB |
2022 Fiscal Year |
ZIP |
410 KB |
2021 Fiscal Year |
ZIP |
233 KB |
2020 Fiscal Year |
ZIP |
211 KB |
2019 Fiscal Year |
ZIP |
223 KB |
2018 Fiscal Year |
ZIP |
216 KB |
2017 Fiscal Year |
ZIP |
215 KB |
2016 Fiscal Year |
ZIP |
209 KB |
2015 Fiscal Year |
ZIP |
197 KB |
2014 Fiscal Year |
ZIP |
148 KB |
Employee Information
These data files include information on all active employees of the School District of Philadelphia, including name, pay rate, title, and location.
Note: This data does not include Charter Schools.
Last Refreshed: Apr 2026 | Next Update: Jul 2026
School Year |
File Type |
File Size |
|---|---|---|
SY 2025-2026 |
Zip file |
2.5 MB |
SY 2024-2025 |
Zip file |
2.1 MB |
SY 2023-2024 |
Zip file |
2.1 MB |
SY 2022-2023 |
Zip file |
1.8 MB |
SY 2021-2022 |
Zip file |
1.8 MB |
SY 2020-2021 |
Zip file |
1.7 MB |
SY 2019-2020 |
Zip file |
1.7 MB |
SY 2018-2019 |
Zip file |
1.5 MB |
SY 2017-2018 |
Zip file |
1.2 MB |
SY 2016-2017 |
Zip file |
1.5 MB |
SY 2015-2016 |
Zip file |
1.5 MB |
SY 2014-2015 |
Zip file |
1.1 MB |
All Available Years |
Zip file |
19.7 MB |
Teacher Attendance
The Teacher Attendance files contain three metrics: Average Daily Attendance (ADA), 90% or more attendance (90%+), and 95% or more attendance (95%+). Please reference the business rules provided in the data information document for more details on these metrics.
The Average Daily Attendance (ADA) calculation aggregates absences recorded for all employees in teacher positions and compares them to the total number of contracted days for teachers.
The 95% or more attendance (95%+) metric displays the percentage of teachers who were present for at least 95% of contracted days.
Within Month district level file includes 90%+ and ADA where the attendance rate is calculated for each month based on attendance records. This file refreshes quarterly.
Important: Previously published teacher Average Daily Attendance (ADA) files are still available as an archive version, but the calculations do not reflect the current business rules.
Notes:
- This data does not include charter schools.
- All K-12 district schools are included in the calculations, including PVA and Widener, which do not receive an SPR.
- In order to align with the metric used in the SPREE, starting in 2023-24 the School-level and District-level end of year files shifted to include 90% teacher attendance.
School-Level Attendance: Last Refreshed: Feb 2026| Next Update: Spring 2027
District-Level Attendance: Last Refreshed: Feb 2026 | Next Update: Spring 2027
District-Level Monthly Attendance: Last Refreshed: May 2026 | Next Update: Aug 2026
Note: In January 2025, the District transitioned to a new employee information system. All data is considered preliminary and is subject to change prior to the final end of year values.
School Year |
Aggregation Type |
File Type |
File Size |
Additional Information |
|---|---|---|---|---|
SY 2023-2024 through 2024-2025 |
School-Level |
CSV |
22 KB |
Data Information |
SY 2021-2022
|
District-Level |
CSV |
1 KB |
Data Information |
SY 2019-2020
|
District-Level Within Month |
CSV |
3 KB |
pending |
Archive – 95% and ADA
|
School and District-Level |
Zip file |
29 KB |
Not Available |
Archive – ADA
|
School and District-Level |
Zip file |
17 KB |
Not Available |
Teacher Demographics
Teacher Demographics files contain the number and percentages of teachers in each racial/ethnic and gender category.
Notes:
- This data does not include charter schools.
- The snapshot date is October 31st for each school year.
- Data for the 2023-2024 school year was refreshed in 2024-2025 to incorporate retroactive corrections that were made to the “Ethnicity Not Available” category.
Last Refreshed: Jan 2026 | Next Update: Jan 2027
School Year |
Aggregation Type |
File Type |
File Size |
Additional Information |
|---|---|---|---|---|
SY 2016-2017
|
District-Level |
CSV |
10 KB |
Data Information |
School Leader Demographics
School Leader Demographics file contains the number and percentages of principals and assistant principals in each racial/ethnic and gender category.
Notes:
- This data does not include charter schools.
- The snapshot date is October 31st for each school year.
- Data for the 2023-2024 school year was refreshed in 2024-2025 to incorporate retroactive corrections that were made to the “Ethnicity Not Available” category.
Last Refreshed: Jan 2026 | Next Update: Jan 2027
School Year |
Aggregation Type |
File Type |
File Size |
Additional Information |
|---|---|---|---|---|
SY 2016-2017
|
District-Level |
CSV |
8 KB |
Data Information |
Staff Vacancies
These data files include information on the number of FTE staff vacancies across the School District of Philadelphia.
Notes:
- These data do not include charter schools.
- Files for 2024-2025 and onward are produced quarterly.
- Data regarding staff vacancies is submitted to the Pennsylvania Department of Education (PDE) on an ongoing basis. During a quality review, inaccuracies were discovered in three of the data submissions (October 2023, October 2024, and January 2025). In the October 2023 submission, also posted on the PDE website, the vacancy numbers for “Special Ed, Life Skills, Autistic and Multiple-Disability Support” positions were undercounted due to a manual calculation error. In the 2024-25 submissions, also posted on the PDE website, the vacancy numbers for “Special Ed, Life Skills, Autistic and Multiple-Disability Support” positions include incorrect staff titles and are therefore overcounting vacancies. A new quality assurance process is in place within the District to ensure data accuracy and alignment across internal and state reporting moving forward. For all future reports, please visit the PDE website at https://www.pa.gov/agencies/education/data-and-reporting/school-staff/professional-and-support-personnel.html.
Last Refreshed: May 2025 | Next Update: Aug 2025
School Year |
File Type |
File Size |
|---|---|---|
SY 2024-2025 |
Zip file |
33 KB |
SY 2023-2024 |
Excel XLSX |
33 KB |
District and School Budget
Click below to download School Budgets or District Budget from fiscal year 2015.
For more information about recent District and School budgets, please visit the Office of Management & Budget.
School Budget: Last refreshed: 2025-2026 | Next Update: 2026-2027
District Budget: Last refreshed: 2014-2015 | Next Update: Discontinued
Fiscal Year |
Budget Type |
File Type |
File Size |
Additional Information |
|---|---|---|---|---|
2026 Fiscal Year |
School |
Zip |
170 MB |
N/A |
2025 Fiscal Year |
School |
Zip |
171 MB |
N/A |
2024 Fiscal Year |
School |
Zip |
172 MB |
N/A |
2023 Fiscal Year |
School |
Zip |
164 MB |
N/A |
2022 Fiscal Year |
School |
Zip |
53 MB |
N/A |
2021 Fiscal Year |
School |
Zip |
136 MB |
N/A |
2020 Fiscal Year |
School |
Zip |
127 MB |
N/A |
2019 Fiscal Year |
School |
Zip |
22 MB |
N/A |
2015 Fiscal Year |
District |
CSV |
92 KB |
Data Information |
Full Time Employee (FTE)
Click below to download Full Time Employee (FTE) counts.
Last refreshed: 2015-2016 | Next Update: Discontinued
Fiscal Year |
File Type |
File Size |
Additional Information |
|---|---|---|---|
2014 and 2015 |
CSV |
49 KB |
Data Information |
Advancing Education Safely
Hybrid Learning Selection
The Advancing Education Safely dashboard includes information about COVID-19 testing and confirmed cases for SDP students and staff in 2021-22.
Hybrid Learning Selection
Click below to view information about the students and families who selected hybrid learning in 2020-21. The data files are an extract from the Advancing Education Safely dashboard for the week of June 6-12, 2021.
Last Refreshed: June 2021
Data Governance
The Office of Data Governance (ODG) is committed to ensuring that the School District of Philadelphia’s data is accurate, consistent, and used responsibly. Good data helps us better serve our students, families, and schools. We work with staff across the District to promote strong data practices, clear standards, and informed decisions.
What is Data Governance?
Data governance is the process of managing an organization’s data as a valuable asset so that it is accurate, consistent, secured, and available. In SDP, data governance encompasses the policies, procedures, practices, and roles that ensure data integrity, quality, and trust.
What We Do
- Develop and maintain policies that govern data quality.
- Measure, monitor, and improve data quality using clear processes and effective tools, including data quality rules and a data quality dashboard.
- Facilitate partnerships with other departments to align data management practices and initiatives across the District.
- Establish and guide data stewardship roles for accountability and oversight.
- Use systems and standards to manage metadata (information about the data) to ensure it is documented and easy to understand.
- Maintain a centralized data catalog to improve data discoverability and trust across departments.
- Classify and label data based on sensitivity and compliance needs (e.g., PII, HIPAA, FERPA).
- Educate stakeholders through workshops, documentation, and ongoing support.
- Empower data-driven decisions by ensuring trusted, high-quality data to support student success.
Supporting Accelerate Philly
Priority Area 5.12 of Accelerate Philly focuses on the importance of a clear data strategy in SDP, emphasizing that Central Office must model best practices of data use, communicate expectations for and support data use across the system, and convene critical conversations that center on performance data.
Our ongoing data governance work directly supports this priority by providing a comprehensive approach to improving data quality, accessibility, and communication across the District.
Research Publications
Research Roundup Webinars
The Office of Research and Evaluation hosts periodic webinars summarizing research on different topics, including those most closely aligned to the Board’s Goals and Guardrails. Each webinar is about an hour long, with opportunities for attendees to ask questions. Most of our webinars are recorded and posted on this website for those who wish to view them at a later date.
Join our mailing list to receive invitations to future Research Roundups!
Math Performance in SDP:
Trends in PSSA and Star Results – May 2026
View the presentation
Illustrative Math Curriculum Implementation Evaluation: Years 1 & 2 – March 2026
View the presentation
Senior Exit Survey, “Summer Melt” Study,
and CTE & Graduate Follow-up Surveys – November 2025
View the presentation
View Past Research Roundup Webinars
2025
The Philly School Experience Survey (PSES): 2024-25 Results & Resources – September 2025
View the webinar | View the presentation
The School Progress Report on Education and Equity (SPREE) and SPOTlight – July 2025
View the webinar | View the presentation
Summer Programs in the School District of Philadelphia – June 2025
View the webinar | View the presentation
Open Data “Resource Roundup” – April 2025
View the webinar | View the presentation
2024
Pathways to Graduation: A Closer Look at Historical Keystone Data and the First Year of Act 158 Outcomes in SDP – December 2024
View the webinar | View the presentation
Postsecondary “Resource Roundup” – September 2024
View the webinar | View the presentation
The Relationship between Star Assessments and PSSA Performance in 2022-23 – July 2024
View the webinar | View the presentation
2022-23 Philly School Experience Survey Results: School Climate and Instructional Environment – April 2024
View the webinar | View the presentation
Youth Risk Behavior Survey (YRBS) – Philadelphia – February 2024
View the webinar | View the presentation
2023
The Ninth Grade On-Track Metric in SDP: Origins, Trends, and How Staff Use Ninth Grade On-Track Data to Support Students – December 2023
View the webinar | View the presentation
English Learner Experiences in SDP: Enrollment Trends, Linguistic Diversity, and Supports for Students – September 2023
View the webinar | View the presentation
The School Progress Report on Education and Equity (SPREE) – July 2023
View the webinar | View the presentation
The Impact of School Facility Investments on Students and Homeowners: Evidence from Los Angeles – May 2023
View the webinar | View the presentation
Focus on Student Attendance – April 2023
View the webinar | View the presentation
Dismantling the School-to-Prison Pipeline: The Philadelphia Police School Diversion Program – February 2023
Webinar recording not available | View the presentation
2022
The District-Wide Surveys – December 2022
View the webinar | View the presentation
Changing the Finish Line: Implications of new graduation requirements in the School District of Philadelphia – October 2022
View the webinar | View the presentation
Understanding the SDP Landscape by Focusing on Two Student Groups: English Learners and Students in Special Education – July 2022
View the webinar | View the presentation
Food Insecurity in the School District of Philadelphia – June 2022
View the webinar | View the presentation
9th Grade On-Track Rates and High School Graduation – May 2022
View the webinar | View the presentation
Math Performance in Grades 3-8 – April 2022
View the webinar | View the presentation
Literacy Performance in Grades K-3 – March 2022
View the webinar | View the presentation
 Philly School Experience Survey (PSES)
The Philly School Experience Survey is the annual survey for Philly public school students, families, and staff.
2024-25 Survey Results
FAQs
- Why are some reports missing?
If your school does not have a report, it is because not enough students, parents/guardians, or teachers completed the survey. At least 30% of students and teachers and 15% of parents/guardians must have completed the survey in order for their data to appear in a report. If none of these minimum rates were reached, a school will not have a report. - Why are some years missing data in the line graphs?
The response rate thresholds are applied to each year’s data. A missing dot on a line graph means that the minimum number of respondents did not respond to that topic in that year. - What does i.s. Mean?
When response rate thresholds are not met or a specific subtopic or question is not relevant for a particular school, you may see “i.s.” (insufficient sample) or “insufficient data” in the report. Common reasons why some subtopics and questions are not relevant for some schools include that:
- The student survey is for grades 3-12 only.
- Some student survey questions (e.g., those related to Bullying or Diversity, Equity and Inclusion) are only for grades 6-12 students.
- Charter schools do not participate in the support staff survey.
- Some Charter and alternative schools do not participate in the teacher and/or parent/guardian surveys.
- Some questions (e.g., Professional Capacity questions related to District-led professional development) are not shown to Charter and alternative schools.
- How many respondents are needed in order for the data to be displayed?
The minimum response rate for students and teachers is 30% and for parents/guardians, it is 15%. For topics that include more than one respondent group, at least two of those groups must meet their threshold in order for schools to get an overall score for that topic. For example, the Family Engagement topic score includes both parent/guardian and teacher responses, so both groups must meet the minimum response rate in order for a school to get that topic score.
- How can the response rate be over 100%?
For teachers, we calculate response rates based on the number of active teachers at each school as of May 1. Sometimes teachers who are on extended leave complete the survey if they still have access to their employee portal, and some teachers respond earlier in the survey window and then leave the school. Both these situations could result in a response rate over 100%. For students, we calculate response rates based on the number of enrolled students in grades 3-12 at each school as of May 1. If a student completes the survey while enrolled at your school and then moves to a different school, their response will still count for your school. In some situations, it is possible for a school to have more responses than students enrolled on May 1. For parents/guardians, survey response rates are estimated by taking the total number of valid surveys received for the school (or Network, sector, etc.) and dividing by the total number of households with K-12 students in the school (or Network, sector, etc.). While families were encouraged to submit just one survey per household, some do submit more than one; for this reason, it is possible for some schools to have a response rate greater than 100%.
- How are the topic and subtopic scores calculated?
Each response option for each question is given a numeric value, with the most positive response option getting the highest and the least positive response option the lowest. Next, the numeric responses for all the questions in a subtopic or topic are averaged. Then, the averages are converted to a 1-10 scale. A subtopic or topic score of 10 means that all respondents selected the most positive response options for all the questions in the subtopic or topic.
- What does “N/A” or “-” mean? (reports prior to 2022-23 only)
Not all respondent groups are asked questions that align to each of the five topics. If this is the case, “N/A” (not applicable) or “-” appears in place of a topic score or subtopic score.
- Why are there fewer than five dots on my radar plot? (reports prior to 2020-21 only)
The response rate thresholds are applied to each topic. A missing dot on the radar plot means that the minimum number of respondents did not respond to that topic in that year.
About the Philly School Experience Survey (PSES)
Each year, the Office of Research and Evaluation (ORE) administers the School District of Philadelphia (SDP) Philly School Experience Survey (PSES) to Philadelphia public schools in both the District and Charter sectors.
This survey, which is administered to students, parents/guardians, teachers, school support staff, and principals/assistant principals, measures six key topics related to school improvement:
- School Climate – Areas affecting the school environment: school mission and vision, respectful relationships, student safety and support, and challenges to student learning.
- Instructional Environment – Student engagement and how students, parents/guardians, and teachers feel about the quality of teaching and learning at their school.
- School Leadership – How school leaders communicate and implement their school vision, how they manage their responsibilities, and how they perceive their level of autonomy.
- Professional Capacity – How school staff work together, what types of professional development teachers receive, and if teachers feel supported in growing and innovating in their classrooms.
- Family Engagement – How schools reach out to and communicate with parents/guardians, what parents/guardians think about these efforts, and how parents/guardians are getting involved with their child’s education.
- Diversity, Equity, and Inclusion – How often issues of race, ethnicity, and culture are addressed in schools, the extent to which all students and staff feel they are valued members of the school community, how integrated and fair school is for students from different backgrounds, and the extent to which schools promote an anti-racist professional culture.
The Philly School Experience Survey is one of the best tools we have for assessing different perspectives across topics. Your responses each year are also essential measures of progress related to our new Board Goals & Guardrails.
Technical Reports
The technical report describes the framework that guided survey development, the administration of the surveys, the processes of survey reliability testing and validation, and the construction of school-level scores for reports.
-
2023-24 Technical Report
-
2022-23 Technical Report
-
2021-22 Technical Report
Note: A new “Representativeness of Respondents” section (pp. 14-24) was added to this report in September 2023; all other information remains unchanged.
-
2020-21 Technical Report
-
2019-20 Technical Report
-
2018-19 Technical Report
-
2017-18 Technical Report
-
2016-17 Technical Report
Survey Archive
Our archive includes all surveys developed, beginning in 2014-15. Survey hard copies are provided in PDF form; surveys were originally disseminated via SurveyMonkey.
Please note that the PDFs are for reference only. If you would like information about obtaining paper copies for parents and guardians, please contact schoolsurveys@philasd.org.
2025-26
-
Parent/Guardian Survey: English | Shqip | عربي | বাংলা | 汉语 | Français | Kreyol ayisyen | ខ្មែរ | Português | Pусский | Español | українська | O’zbek | Việt
-
Student Survey
-
Principal/Assistant Principal Survey
-
Teacher Survey
-
Support Staff Survey
2024-25
-
Parent/Guardian Survey: English | Shqip | عربي | বাংলা | 汉语 | Français | Kreyol ayisyen | ខ្មែរ | Português | Pусский | Español | українська | O’zbek | Việt
-
Student Survey: English | Shqip | عربي | 汉语 | Français | Kreyol ayisyen | ខ្មែរ | Português | Pусский | Español | українська | O’zbek | Việt
-
Principal/Assistant Principal Survey
-
Teacher Survey
-
Support Staff Survey
2023-24
-
Parent/Guardian Survey: English | Shqip | عربي | বাংলা | 汉语 | Français | ខ្មែរ | Português | Pусский | Español | O’zbek | Việt
-
Student Survey:* English | Shqip | عربي | 汉语 | Français | ខ្មែរ | Português | Pусский | Español | Việt
-
Principal/Assistant Principal Survey
-
Teacher Survey
-
Support Staff Survey
*Questions 5-6, 9, 13-18, 23, and 29-36 on the Student Survey are for students in grades 6-12 only. Questions 24-28 are for students in grades 9-12 only.
2022-23
-
Parent/Guardian Survey: English | Shqip | عربي | বাংলা | 汉语 | Français | ខ្មែរ | Português | Pусский | Español | O’zbek | Việt
-
Student Survey:* English | SHQIP | عربي | 汉语 | Français | ខ្មែរ | Português | Pусский | Español | Việt
-
Principal/Assistant Principal Survey
-
Teacher Survey
-
Support Staff Survey
*Questions 8-10 and 24-33 on the Student Survey are for grades 6-12 only.
2021-22
-
Parent/Guardian Survey | Encuesta para padres/encargardos
-
Student Survey*
-
Principal/Assistant Principal Survey
-
Teacher Survey
-
Support Staff Survey
*Questions 25-32 and 37-41 on the Student Survey are for grades 6-12 only.
2020-21
-
Parent/Guardian Survey
-
Student Survey (3-5)
-
Student Survey (6-12)
-
Principal Survey
-
Teacher Survey
-
Support Staff Survey
2019-20
-
Parent/Guardian Survey
-
Student Survey (3-5)
-
Student Survey (6-12)
-
Principal Survey
-
Teacher Survey
-
School Staff Support Survey (Pilot)
2018-19
2017-18
2016-17
2015-16
2014-15
Resources & FAQs
- PSES Dashboard – Explore each topic and question in detail using the Philly School Experience Survey dashboard.
- School Profiles – Review Philly School Experience Survey highlights along with other school information, such as enrollment and assessment data.
- Open Data Files – Download entire data sets using the Philly School Experience Survey open data files.
- PSES Report Library – Visit our archive of published reports.
- Survey Questions
- FAQs
How are the PSES Results Used?
District-Wide Examples
PBIS – targeting supports, progress monitoring, evaluation
The Office of Climate and Culture uses the PSES results to support schools implementing Positive Behavioral Intervention and Supports (PBIS). PBIS coaches are particularly interested in responses to questions about behavior, school discipline, and trusting relationships. Questions on the Teacher Survey like, “My school consistently uses positive behavioral supports to encourage responsible student behavior,” and “I know what is expected of me regarding supporting student behavior,” help PBIS coaches identify which schools need more training/support, and within schools, whether certain grade-level teachers feel more confident than others. PBIS coaches can use this information to support networks/schools/grade-level teams that need additional support and also to build off of successes that already exist in a school community.
Similarly, questions on the Student Survey like, “Other students treat me with respect,” and “I feel safe in the hallways and bathrooms,” help PBIS coaches and schools understand the success of their efforts in implementing PBIS from the student perspective, and can identify a clear place to focus next steps when the survey results do not reflect school or district expectations or goals. The Office of Climate and Culture uses responses as a source of information about the success of the implementation of PBIS in different types of schools and school settings, and the Office of School Safety incorporates survey results into decision-making about other climate support measures, like the placement of school safety officers.
Teacher Professional Development – identifying needs, monitoring progress
The Office of Professional Learning uses responses to the professional capacity construct on the teacher survey to monitor and adapt their approach to district-offered professional development. The professional capacity construct includes questions about innovation (“I am encouraged to try new teaching approaches in my classroom”), peer collaboration (“How often do groups of teachers at your school meet to address the following topics?”), quality of professional development (“Teacher input is taken into consideration when planning district-level/school-level professional development”), content (“How often were District-wide professional development sessions offered by Central Office consistent with your school’s expectations for teaching and learning?”), and delivery (“How often were District-wide professional development sessions cognitively engaging?”). District-level, network-level, school-level, and grade-level teacher responses are used to track the success of PD, particularly related to the implementation of the new math, ELA, and science curricula, and to inform planning, policies, and supports each year.
Health and Wellness – examining trends, targeting supports, evaluation
One goal of the Eat Right Philly program is to encourage students and schools to make healthy choices. The Eat Right Philly team uses questions on the student survey like, “During the past 7 days, how many days were you physically active for at least 60 minutes?” and “Yesterday, how many times did you drink any soda, punch, fruit-flavored drinks…,” to examine trends in healthy behaviors over time as well as to identify which schools and areas could use additional support.
The parent/guardian survey also includes a set of questions on food insecurity, which are used to determine an overall rate of food insecurity for each school with sufficient responses. The Office of Research and Evaluation publishes regular reports analyzing trends in food insecurity at District schools. Food insecurity datasets are also available separately on the Open Data website.
Food Services – customer satisfaction
The Division of Food Services is responsible for providing daily meals to all students in SDP. Each year, staff review results from the student survey to track trends in customer satisfaction and identify areas for additional support and improvement. Questions on the student survey that help inform these decisions include “When I eat school lunch, the food tastes good,” and “Food that should be hot is hot, and food that should be cold is cold.” Food services also use data from three questions on the student survey as a set of Key Performance Indicators that are reported on their Annual Report.
School Improvement Planning Process – identifying needs, monitoring progress, incorporating parent feedback
Staff from the Planning and Evidence-based Supports Office review survey data as part of the continuous improvement planning process conducted in partnership with school leaders. Results from student, teacher, and parent surveys are used to identify needs for new programming or areas of focus for improvement or celebration. Parent/guardian survey responses are also used in accordance with Pennsylvania’s Title I funding requirements. In order to use Title I funds for school improvement, schools must report on parent feedback relative to school mission/vision, quality of instruction, and community engagement. Responses to questions like “Teachers at my child’s school give helpful comments on homework, classwork, and tests,” and “My child’s school provides me with regular feedback about my child’s progress,” are incorporated into the needs assessment portion of the school planning process.
Research and Evaluation – incorporating multiple stakeholder perspectives into research studies
Internal and external researchers rely on PSES results from parents/guardians, teachers, and students to inform progress on major District initiatives like curriculum implementation, Accelerate Philly, and the Goals and Guardrails. Reports and briefs produced by SDP’s Office of Research and Evaluation regularly incorporate PSES results. External researchers are encouraged to use survey responses available on our Open Data website (under the “School Information” category) rather than creating/administering new surveys of parent/guardians, students, and teachers that can detract from instructional time and goals.
School-Level Examples
Family Engagement – identifying and addressing challenges
Schools have used PSES data to identify opportunities to improve their family engagement programs. For example, leaders at one high school noticed that many parents/guardians reported on the PSES that parents didn’t know how or where to access key resources. The school organized new events based on this feedback, such as hosting a breakfast for parents to learn about and explore school resources and information in one place, and a parent drop-in center during report card conferences to talk to school staff about summer jobs, internships and other college preparation programs.
School Leadership – continuously improving and identifying areas of focus
Responses to the School Leadership questions on the teacher survey provide information for new and returning principals and their supervisors (assistant superintendents) for improving school climate. Questions like “The principal at this school sets high standards for student learning” and “The principal at this school works to create a sense of community in this school” provide information about the key areas that leaders need to focus on to improve school climate. Questions about Diversity, Equity, and Inclusion measure whether school leaders are creating a welcoming environment and sense of belonging for students and staff.
Improving School Community – using survey data alongside discipline data to gain more information
District and school leaders use the District’s “QlikBAM” performance management dashboards to track student and school progress and identify areas for improvement. School leaders often use survey responses to learn more information about trends they see in the dashboards, such as unequal (or disproportionate) suspensions based on student race/ethnicity, gender, grade-level, English learner status, or special education status. Looking at groups of student responses to survey questions like “Adults at my school treat people from different races, ethnicities, or cultures fairly,” and “my teachers treat me with respect” based on student characteristics helps school leaders focus on groups or grades of students in their school where there are areas of student-identified concerns.
Attendance – identifying possible reasons for absence and lateness
School leaders use responses to questions about traveling to school, safety in the hallways/bathrooms, bullying, and feeling welcome in school to identify possible reasons why students are late/absent from school. The parent survey asks parents how much of a challenge these different situations are in supporting their child attending school: family responsibilities, feeling safe at school, chronic or ongoing medical issues, public transportation, District-provided transportation, and safety of the child’s walking route. The student survey gives students an opportunity to identify challenges that may limit their on-time attendance, including attendance challenges like “I am bullied at school,” “I feel welcome in school,” “I feel safe in my classes,” and “I feel safe in the hallways and bathrooms.” The teacher survey also provides information about bullying, whether the school communicates the importance of attendance, and student behavior and discipline. School teams track responses from all stakeholder surveys in these areas and identify targeted responses to address student, teacher, and parent concerns about attendance challenges.
2024-25 PSES Results: Selected District Results and Resources – September 2025
View the presentation
2022-23 PSES Results: School Climate and Instructional Environment – April 2024
View the presentation
The District-Wide Surveys – December 2022
View the presentation
Youth Risk Behavior Survey (YRBS)
The Youth Risk Behavior Survey (YRBS), also known as the Youth Risk Behavior Surveillance System (YRBSS), was developed by the Division of Adolescent and School Health (DASH), which is part of the Centers for Disease Control and Prevention (CDC).
The YRBS includes a nationally representative sample of 9th- through 12th-grade students and is conducted every two years, typically during the spring semester. The survey is completely anonymous and voluntary.
What does the YRBS monitor?
The YRBS monitors six health behaviors that contribute to the leading causes of death, disability, and social problems among youth and adults:
- behaviors that contribute to unintentional injuries and violence;
- tobacco use;
- alcohol and other drug use
- sexual behaviors that contribute to unintended pregnancy and sexually transmitted disease
- unhealthy dietary behaviors; and
- inadequate physical activity.
Printable Brochures (2021 Data)


YRBS Reports and Briefs
External Research Review
The School District of Philadelphia values research that contributes to improved educational outcomes for students. Because the District receives a large number of requests from individuals and organizations to conduct research studies and the number of proposed projects is generally larger than the District can accommodate without significantly disrupting instruction, all individuals and organizations interested in conducting research in the District must have their proposals reviewed and approved by the Office of Research and Evaluation’s Research Review Committee (RRC).
What is the purpose of the Research Review Committee (RRC)?
The RRC reviews and tracks all research efforts in the District to ensure that: (1) the research is aligned with District goals; (2) research is not duplicative or unnecessarily burdensome to students or school personnel; (3) all required procedures are followed when conducting research with human subjects in school settings; and (4) research projects do not overlap in ways that make it difficult to interpret the findings.
What does the RRC consider “research”?
The RRC defines research very broadly. You must submit a proposal to the RRC if you propose to: (1) conduct analyses of administrative data that is not already publicly available; (2) collect any information from students, parents, teachers, or administrators; (3) conduct or record observations in a classroom, school, or after-school setting; and/or (4) recruit students, parents, or school personnel to participate in research-related activities. This includes (but is not limited to) all observations, interviews, focus groups, and surveys.
What kinds of studies does the RRC review?
The District permits five types of externally-conducted research: (1) academic studies; (2) Ph.D. dissertations; (3) national surveys; (4) progress monitoring or grant-mandated reporting; and (5) program evaluations. We prioritize proposed academic studies, Ph.D. dissertations, and national surveys that directly align to the Board of Education’s Goals and Guardrails.
Please Note: The District values rigorous, impartial evaluations of implementation and impact. Therefore, program providers may not evaluate their own programs in District schools. Providers wishing to conduct an evaluation must partner with an independent, third-party evaluator. Additionally, the District will provide non-aggregate data only to third-party evaluators.
However, with RRC approval (after completing the proposal process), program providers may collect information related to program implementation for progress monitoring or grant-reporting requirements (but not for evaluation or analyses related to the impact of the program). The RRC will assess the burden on participants, the quality and appropriateness of all data collection instruments, and whether proposed activities will interfere or overlap with other District research initiatives.
Grant Proposals & Evaluations
If the proposed study is related to a grant that provides/will provide services to students or teachers in District schools, or you need a letter of support for a proposed project from the District, please also complete an Intent-to-Apply form for the SDP Office of Grants Development. If your grant proposal involves research, you must contact us at researchreview@philasd.org.
Policies and Procedures
Protection of Human Subjects
This is a brief overview of principles, regulations, and policies that affect research involving human subjects in research activities supported by the Department of Education.
Family Educational Rights and Privacy Act (FERPA)
The Family Educational Rights and Privacy Act is a federal law that protects the privacy of student education records. The law applies to all schools that receive funds under an applicable program of the U.S. Department of Education.
- FERPA Educational Rights and Privacy Act
- Protection of Pupil Rights Amendment (PPRA): This web page offers a succinct summary of the types of survey questions requiring written parental consent.
Clearances
Valid clearances are required to be on file with the Office of Research and Evaluation (ORE) for all those persons conducting work within the District. This rule applies to all who apply through the Research Review Committee (RRC) whose work requires their presence within a school or schools, including working with students online.
For those submitting new proposals, clearances must be valid within one year of the approval date. For those working on approved and active research projects, updated clearances are due to ORE every three years. Valid, updated clearances are required for each submission, even if a researcher is working on other projects. Please note: If you are an SDP employee, you do not need to provide clearances if your clearances on file with the District are current.
Please follow the links below to access the required clearance applications. Once clearances are received, please scan and email the final clearance letters and certificates to researchreview@philasd.org. We cannot verify clearance results with login codes.
- PA Child Abuse Clearance
- FBI Fingerprint Clearance (Enter code: 1KG6XN)
- PA Criminal History Clearance
Submitting A Proposal
All research activities must adhere to the District’s policies and procedures (see above).
Step 1: Review Submission Guidelines
Step 2: Be sure that you can answer “YES” to each of the following questions.
- Does your proposal fall into one of the permitted research categories? (See below.)
- If your proposal is an academic study, a Ph.D. or Ed.D. dissertation, or a national survey, does it align with the Board Goals outlined in the District’s Goals and Guardrails?
- Will findings from your proposed research provide actionable information that can help improve the educational experiences and outcomes of children in Philadelphia?
- If requesting data or survey administration: Have you thoroughly explored all publicly available data, including the Philly School Experience Survey (PSES) results, before determining the need to make a specific data request and/or administer your own survey instruments?
Step 3:
Research Categories
- Progress Monitoring (Grant-Mandated Reporting)
Progress Monitoring is considered by the RRC to be minimally-invasive data collection and/or requests of administrative data required by programs for delivery to funders. Activities will NOT include: any work attempting to measure outcomes. This proposal type is included to allow SDP partners who require such information to submit a proposal without undue burden.
- Program Evaluation
Program Evaluation is any project that involves activities attempting to measure the outcomes of a particular program or intervention. Because of the nature of program evaluation, the RRC requires all Program Evaluation applications to be submitted by Third Party Evaluators. Programs are not permitted to evaluate themselves.
- National Survey
National Surveys are broad-scale, nationally-sampled studies that typically contribute to federally supported or mandated work.
- Academic Study (Non-Dissertation)
Academic studies are any study, whether grant-funded or not, proposed for the sole purpose of answering a specific question and/or expanding upon the current literature in any given field. Academic studies are not being completed in fulfillment of a degree (see Ph.D. or Ed.D. dissertation, below).
- Ph.D. or Ed.D. Dissertation
Ph.D. or Ed.D. dissertations are accepted for review by the RRC but are subject to additional requirements. The RRC does not accept applications for research from master’s-level students or undergraduates. Please see our student researcher requirements document for more information.
Research Forums
The Office of Research and Evaluation (ORE) hosts monthly Research Forums as a requirement for Research Review Committee (RRC) proposal submission.
- Research Forum Dates – forums are typically held on the first Tuesday of each month, with some exceptions.
- All research forums are currently held via Zoom.
- RSVP to researchreview@philasd.org
Research Data Agreements
Before requesting any data, please reference our open data sources and review our Standard Terms for Researchers. If you intend to use District administrative data (i.e., grades, average daily attendance, suspensions) within your research, please note that all requests for such data must be made through the Research Review Committee. Individual schools or offices are not authorized to release the data directly to you (please see Policies and Procedures above).
All requested data must be reviewed and approved by the Research Review Committee (RRC) via your online research proposal. When asked about your research content in the online proposal process, select “I want to do secondary analysis of individual level data” or “I want to do secondary analysis of aggregate data.” Please request only the data that you feel are necessary for your planned analyses and be as detailed as possible; the RRC will respond with the data that will be provided by the District. When making this decision, the RRC considers current data availability and necessity. If you are unsure if your data needs will require RRC review and approval, please view our reference matrix.
Once the RRC has approved your data request, you will receive a Data Agreement. You must sign this agreement, which includes our Standard Terms for Researchers. This agreement will describe the data that the District will provide for you, and it will include an estimate for the cost of data pulling, cleaning, and delivery. Once you have signed the Data Agreement and returned it by mail, you can enter your final data request here. All data agreements, once fully executed, are binding.
Due to the volume of requests we receive, it will take at least 60 business days for your data request to be filled (beyond the research review and data agreement process, if applicable).
Amending Your Study
If you have a previously approved study that, due to unforeseen circumstances, needs to be changed, you may submit an amendment to the Research Review Committee (RRC) for review. Amendments have no cost associated with them.
Amendment Considerations
Amendments will be considered for minor changes to original proposals, such as the addition or deletion of a sample school or site, the altering of a tool or instrument, or the modification of some data collection procedures. Amendments will be denied for large procedural or structural changes to your original proposal; you will be asked to submit a new proposal.
The RRC accepts amendments on proposals that are up to three years old. This is to assure that proposals align with the changing academic and procedural environment surrounding educational research. If your proposal requires changes and is more than three years old, you will need to submit a new proposal.
Procedure for Submitting an Amendment
- Assure that your proposal is no more than three years old and that any proposed changes to your project are minor (see above).
- Use the Proposal Amendment Form and fill out to the best of your ability.
- Submit the form (please include your study’s proposal number) and any other relevant materials to researchreview@philasd.org.
Research Review Statistics
RRC Applications and Approval Rates
During the 2024-25 fiscal year (July 2024 to June 2025), the RRC received 108 submissions, including 70 proposals and 38 amendments.
Proposals and Approvals
Between July 2024 and June 2025, the RRC received 70 proposals from various organizations and universities. Entities that submitted the most proposals were University of Pennsylvania, Research for Action, Children’s Hospital of Philadelphia, Gwynedd Mercy, Mathematica, and Temple University. Of the total submissions, 92 (85%) were either fully, conditionally, or partially approved.
RRC Monthly Research Forum
In November 2016, ORE began offering a monthly Research Review Forum, open to everyone and required for anyone submitting proposals to the RRC. The forum helps ensure that external researchers and other stakeholders know about District standards and procedures for conducting research and how to apply for access to District data. In the 2024-25 fiscal year, 88 people attended an RRC forum.
Something Missing? Broken Link?