There are different ways to calculate attendance. The School District of Philadelphia (SDP) reports the percentage of students attending at least 95% of instructional days. Other districts may focus on Average Daily Attendance (ADA). Here’s how they’re different.

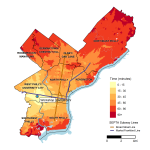
SDP’s School Profiles, which display District-level data as well as school-level information about SPR scores, climate, and standardized test performance, now have an additional functionality. Thanks to a partnership with the Philadelphia Education Research Consortium (PERC), you may now view expected public transit times to each high school’s physical location from anywhere in the city.

SDP’s Alternative Education Progress Report (AEPR) provides a high-level overview of how our alternative education programs are performing in the areas, or domains, that matter the most for student success, and it includes reports designed to evaluate the metrics most relevant to each school model and purpose. This brief analyzes data from 2016-17 to 2018-19 to identify trends by report type and domain.

This six-page brief outlines the school priorities and goals identified during the planning process for the 2020-21 school year, which took place from February to August 2020.

Beginning in the 2020-21 school year, the School District of Philadelphia required that formative assessments in reading and math be administered in all grades in all schools. The aimswebPlus assessment is required for grades K-5 and the Star assessment is required for grades 6-12. In addition, aimswebPlus is being administered to eligible special education students…

A short summary of research that supports shifts in SDP’s revised early literacy framework (PreK-Grade 3).

An overview of responses to five 2019-20 District-Wide Survey items related to technology.

We are gathering information from a variety of sources about how digital learning is going. This document provides a summary of the questions that we’re asking across five main topics.

A summary of school-level and student-level trends within each SPR performance tier from 2014-15 through 2018-19.

Take a moment to check out the District’s new School Profiles website! The improvements to the previous School Profiles site are based on guidance and feedback from parents, community groups, principals, a market research consultant, and numerous SDP program offices. Importantly, the new School Profiles link directly to the District’s 2020-21 Reopening Readiness Dashboard website,…